

Journalctl — отличный инструмент для анализа логов, обычно один из первых с которым знакомятся начинающие администраторы linux систем. Встроенные возможности ротации, богатые возможности фильтрации и возможность просматривать логи всех systemd unit-сервисов одним инструментом очень удобны и заметно облегчают работу системным администраторам.
Эта статья рассматривает основные возможности утилиты journalctl и различные варианты ее применения. С помощью journalctl можно просматривать логи системы, чтобы решить возникшие проблемы на рабочей станции или сервере использующие дистрибутив linux с демоном инициализации systemd, де-факто уже ставшим стандартом в современных Linux-системах, например: RHEL, CentOS, Fedora, Debian и многих других.
Существует мнение, что systemd не так уж и хорош — он нагружает систему и это все еще предмет для споров на сегодняшний день, но нельзя отрицать, что он предоставляет прекрасный набор инструментов для управления системой и поиска проблем. Представьте, что вам приходится иметь дело с проблемным сервером, который даже не загружается — в таком случае можно загрузиться с live-дистрибутива, смонтировать системный раздел и просмотреть логи systemd, чтобы понять, в чем проблема.
Systemd
Systemd состоит из трех основных компонентов:
- systemd — менеджер системы и сервисов
- systemctl — утилита для просмотра и управление статусом сервисов
- systemd-analyze — предоставляет статистику по процессу загрузки системы, проверяет корректность unit-файлов и так же имеет возможности отладки systemd
Journald
Journald — системный демон журналов systemd. Systemd спроектирован так, чтобы централизованно управлять системными логами от процессов, приложений и т.д. Все такие события обрабатываются демоном journald, он собирает логи со всей системы и сохраняет их в бинарных файлах.
Преимуществ централизованного логирования событий в бинарном формате достаточно много, например системные логи можно транслировать в различные форматы, такие как простой текст, или в JSON, при необходимости. Так же довольно просто можно отследить лог вплоть до одиночного события используя фильтры даты и времени.
Файлы логов journald могут собирать тысячи событий и они обновляются с каждым новым событием, поэтому если ваша Linux-система работает достаточно долго — размер файлов с логами может достигать несколько гигабайт и более. Поэтому анализ таких логов может происходить с задержками, в таком случае, при анализе логов можно фильтровать вывод, чтобы ускорить работу.
Файл конфигурации journald
Файл конфигурации можно найти по следующему пути: /etc/systemd/journald.conf, он содержит различные настройки journald, я бы не рекомендовал изменять этот файл, если вы точно не уверены в том, что делаете.
Каталог с журналом journald располагается /run/log/journal (в том случае, если не настроено постоянное хранение журналов, но об этом позже).
Файлы хранятся в бинарном формате, поэтому нормально их просмотреть с помощью cat или nano, как привыкли многие администраторы — не получится.
Использование journalctl для просмотра и анализа логов
Основная команда для просмотра:
# journalctl
Она выведет все записи из всех журналов, включая ошибки и предупреждения, начиная с того момента, когда система начала загружаться. Старые записи событий будут наверху, более новые — внизу, вы можете использовать PageUp и PageDown чтобы перемещаться по списку, Enter — чтобы пролистывать журнал построчно и Q — чтобы выйти.
По умолчанию journalctl выводит время событий согласно настроенного в вашей системе часового пояса, также journalctl позволяет просмотреть логи с временем UTC (в этом стандарте времени сохраняются события внутри файлов journald), для этого можно использовать команду:
# journalctl --utc
Фильтрация событий по важности
Система записывает события с различными уровнями важности, какие-то события могут быть предупреждением, которое можно проигнорировать, какие-то могут быть критическими ошибками. Если мы хотим просмотреть только ошибки, игнорируя другие сообщения, введем команду с указанием кода важности:
# journalctl -p 0
Для уровней важности, приняты следующие обозначения:
- 0: emergency (неработоспособность системы)
- 1: alerts (предупреждения, требующие немедленного вмешательства)
- 2: critical (критическое состояние)
- 3: errors (ошибки)
- 4: warning (предупреждения)
- 5: notice (уведомления)
- 6: info (информационные сообщения)
- 7: debug (отладочные сообщения)
Когда вы указываете код важности, journalctl выведет все сообщения с этим кодом и выше. Например если мы укажем опцию -p 2, journalctl покажет все сообщения с уровнями 2, 1 и 0.
Настройка хранения журналов
По умолчанию journald перезаписывает свои журналы логов при каждой перезагрузке, и вызов journalctl выведет журнал логов начиная с текущей загрузки системы.
Если необходимо настроить постоянное сохранение логов, потребуется отдельно это настроить, т.к. разработчики отказались от постоянного хранения всех журналов, чтобы не дублировать rsyslog.
Когда в конфигурационном файле /etc/systemd/journald.conf параметру Storage= задано значение auto) и каталога /var/log/journal/ не существует, журнал будет записываться в /run/log/journal без сохранения между перезагрузками, если /var/log/journal/ существует, журналы будут сохраняться в нем, на постоянной основе, но если каталог будет удален, systemd не пересоздаст его автоматически и вместо этого будет вести журнал снова в /run/systemd/journal без сохранения. Каталог может быть пересоздан в таком случае, если добавить Storage=persistent в journald.conf и перезапустить systemd-journald.service (или перезагрузиться).
Создадим каталог для хранения журналов, установим необходимые атрибуты и перезапустим службу:
# mkdir /var/log/journal
# systemd-tmpfiles --create --prefix /var/log/journal
# systemctl restart systemd-journald
Просмотр журналов загрузки
Если journald был настроен на постоянное хранение журналов, мы можем просматривать журналы логов по каждой отдельной загрузке, следующая команда выведет список журналов:
# journalctl --list-boots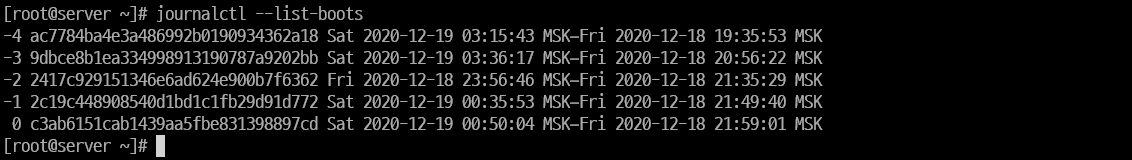
Первый номер показывает номер журнала, который можно использовать для просмотра журнала определенной сессии. Второй номер boot ID так же можно использовать для просмотра отдельного журнала.
Следующие две даты, промежуток времени в течении которого в него записывались логи, это удобно если вы хотите найти логи за определенный период.
Например, чтобы просмотреть журнал начиная с текущего старта системы, можно использовать команду:
# journalctl -b 0А для того, чтобы просмотреть журнал предыдущей загрузки:
# journalctl -b -1Просмотр журнала за определенный период времени
Journalctl позволяет использовать такие служебные слова как “yesterday” (вчера), “today” (сегодня), “tomorrow” (завтра), или “now” (сейчас).
Поэтому мы можем использовать опцию «—since» (с начала какого периода выводить журнал).
С определенной даты и времени:
# journalctl --since "2020-12-18 06:00:00"С определенной даты и по определенное дату и время:
# journalctl --since "2020-12-17" --until "2020-12-18 10:00:00Со вчерашнего дня:
# journalctl --since yesterdayС 9 утра и до момента, час назад:
# journalctl --since 09:00 --until "1 hour ago"Просмотр сообщений ядра
Чтобы просмотреть сообщения от ядра Linux за текущую загрузку, используйте команду с ключом -k:
# journalctl -k
Просмотр журнала логов для определенного сервиса systemd или приложения
Вы можете отфильтровать логи по определенному сервису systemd. Например, что бы просмотреть логи от NetworkManager, можно использовать следующую команду:

# journalctl -u NetworkManager.serviceЕсли нужно найти название сервиса, используйте команду:
# systemctl list-units --type=serviceТак же можно просмотреть лог приложения, указав его исполняемый файл, например чтобы просмотреть все сообщения от nginx за сегодня, мы можем использовать команду:
# journalctl /usr/sbin/nginx --since todayИли указав конкретный PID:
# journalctl _PID=1Дополнительные опции просмотра
Следить за появлением новых сообщений (аналог tail -f):
# journalctl -fОткрыть журнал «перемотав» его к последней записи:
# journalctl -eЕсли в каталоге с журналами очень много данных, то фильтрация вывода journalctl может занять некоторое время, процесс можно значительно ускорить с помощью опции —file, указав journalctl только нужный нам журнал, за которым мы хотим следить:
journalctl --file /var/log/journal/e02689e50bc240f0bb545dd5940ac213/system.journal -fПо умолчанию journalctl отсекает части строк, которые не вписываются в экран по ширине, хотя иногда перенос строк может оказаться более предпочтительным. Управление этой возможностью производится посредством переменной окружения SYSTEMD_LESS, в которой содержатся опции, передаваемые в less (программу постраничного просмотра, используемую по умолчанию). По умолчанию переменная имеет значение FRSXMK, если убрать опцию S, строки не будут обрезаться.
Например:
SYSTEMD_LESS=FRXMK journalctlОграничение размера журнала
Если journald настроен что бы сохранять журналы после перезагрузки, то по умолчанию размер журнала ограничен 10% от объема файлового раздела и максимально может занять 4 Гб дискового пространства.
Максимальный объем журнала можно скорректировать, раскомментировав и отредактировав следующий параметр в файле конфигурации journald:
SystemMaxUse=50MУдаление журналов
Удалить файлы архивных журналов, можно вручную с помощью rm или использовав journalctl.
Удалить журналы, оставив только последние 100 Мб:
# journalctl --vacuum-size=100MУдалить журналы, оставив журналы только за последние 7 дней:
# journalctl --vacuum-time=7dЗаключение
Служба журналирования логов journald очень мощный и гибкий инструмент, и если вы знаете как его использовать, он может сделать вашу жизнь намного проще во время поиска причин проблем с системой или ее сервисами.


NAME
journalctl — Query the systemd journal
SYNOPSIS
journalctl [OPTIONS…] [MATCHES…]
DESCRIPTION
journalctl may be used to query the contents of the systemd(1)
journal as written by systemd-journald.service(8).
If called without parameters, it will show the full contents of
the journal, starting with the oldest entry collected.
If one or more match arguments are passed, the output is filtered
accordingly. A match is in the format «FIELD=VALUE», e.g.
«_SYSTEMD_UNIT=httpd.service», referring to the components of a
structured journal entry. See systemd.journal-fields(7) for a list of
well-known fields. If multiple matches are specified matching different
fields, the log entries are filtered by both, i.e. the resulting output will
show only entries matching all the specified matches of this kind. If two
matches apply to the same field, then they are automatically matched as
alternatives, i.e. the resulting output will show entries matching any of
the specified matches for the same field. Finally, the character
«+» may appear as a separate word between other terms on the
command line. This causes all matches before and after to be combined in a
disjunction (i.e. logical OR).
It is also possible to filter the entries by specifying an
absolute file path as an argument. The file path may be a file or a symbolic
link and the file must exist at the time of the query. If a file path refers
to an executable binary, an «_EXE=» match for the canonicalized
binary path is added to the query. If a file path refers to an executable
script, a «_COMM=» match for the script name is added to the
query. If a file path refers to a device node, «_KERNEL_DEVICE=»
matches for the kernel name of the device and for each of its ancestor
devices is added to the query. Symbolic links are dereferenced, kernel names
are synthesized, and parent devices are identified from the environment at
the time of the query. In general, a device node is the best proxy for an
actual device, as log entries do not usually contain fields that identify an
actual device. For the resulting log entries to be correct for the actual
device, the relevant parts of the environment at the time the entry was
logged, in particular the actual device corresponding to the device node,
must have been the same as those at the time of the query. Because device
nodes generally change their corresponding devices across reboots,
specifying a device node path causes the resulting entries to be restricted
to those from the current boot.
Additional constraints may be added using options —boot,
—unit=, etc., to further limit what entries will be shown (logical
AND).
Output is interleaved from all accessible journal files, whether
they are rotated or currently being written, and regardless of whether they
belong to the system itself or are accessible user journals.
The set of journal files which will be used can be modified using
the —user, —system, —directory, and —file
options, see below.
All users are granted access to their private per-user journals.
However, by default, only root and users who are members of a few special
groups are granted access to the system journal and the journals of other
users. Members of the groups «systemd-journal», «adm»,
and «wheel» can read all journal files. Note that the two latter
groups traditionally have additional privileges specified by the
distribution. Members of the «wheel» group can often perform
administrative tasks.
The output is paged through less by default, and long lines
are «truncated» to screen width. The hidden part can be viewed by
using the left-arrow and right-arrow keys. Paging can be disabled; see the
—no-pager option and the «Environment» section below.
When outputting to a tty, lines are colored according to priority:
lines of level ERROR and higher are colored red; lines of level NOTICE and
higher are highlighted; other lines are displayed normally.
OPTIONS
The following options are understood:
—no-full, —full, -l
Ellipsize fields when they do not fit in available
columns. The default is to show full fields, allowing them to wrap or be
truncated by the pager, if one is used.
The old options -l/—full are not useful anymore,
except to undo —no-full.
-a, —all
Show all fields in full, even if they include unprintable
characters or are very long.
-f, —follow
Show only the most recent journal entries, and
continuously print new entries as they are appended to the journal.
-e, —pager-end
Immediately jump to the end of the journal inside the
implied pager tool. This implies -n1000 to guarantee that the pager
will not buffer logs of unbounded size. This may be overridden with an
explicit -n with some other numeric value, while -nall will
disable this cap. Note that this option is only supported for the
less(1) pager.
-n, —lines=
Show the most recent journal events and limit the number
of events shown. If —follow is used, this option is implied. The
argument is a positive integer or «all» to disable line limiting.
The default value is 10 if no argument is given.
—no-tail
Show all stored output lines, even in follow mode. Undoes
the effect of —lines=.
-r, —reverse
Reverse output so that the newest entries are displayed
first.
-o, —output=
Controls the formatting of the journal entries that are
shown. Takes one of the following options:
short
is the default and generates an output that is mostly
identical to the formatting of classic syslog files, showing one line per
journal entry.
short-full
is very similar, but shows timestamps in the format the
—since= and —until= options accept. Unlike the timestamp
information shown in short output mode this mode includes weekday, year
and timezone information in the output, and is locale-independent.
short-iso
is very similar, but shows ISO 8601 wallclock
timestamps.
short-precise
is very similar, but shows timestamps with full
microsecond precision.
short-monotonic
is very similar, but shows monotonic timestamps instead
of wallclock timestamps.
short-unix
is very similar, but shows seconds passed since January
1st 1970 UTC instead of wallclock timestamps («UNIX time»). The time
is shown with microsecond accuracy.
verbose
shows the full-structured entry items with all
fields.
export
serializes the journal into a binary (but mostly
text-based) stream suitable for backups and network transfer (see Journal
Export Format[1] for more information).
json
formats entries as JSON data structures, one per line
(see Journal JSON Format[2] for more information).
json-pretty
formats entries as JSON data structures, but formats them
in multiple lines in order to make them more readable by humans.
json-sse
formats entries as JSON data structures, but wraps them
in a format suitable for Server-Sent Events[3].
cat
generates a very terse output, only showing the actual
message of each journal entry with no metadata, not even a timestamp.
—utc
Express time in Coordinated Universal Time (UTC).
—no-hostname
Don’t show the hostname field of log messages originating
from the local host. This switch only has an effect on the short family
of output modes (see above).
-x, —catalog
Augment log lines with explanation texts from the message
catalog. This will add explanatory help texts to log messages in the output
where this is available. These short help texts will explain the context of an
error or log event, possible solutions, as well as pointers to support forums,
developer documentation, and any other relevant manuals. Note that help texts
are not available for all messages, but only for selected ones. For more
information on the message catalog, please refer to the Message Catalog
Developer Documentation[4].
Note: when attaching journalctl output to bug reports,
please do not use -x.
-q, —quiet
Suppresses all info messages (i.e. «— Logs begin at
…», «— Reboot —«), any warning messages regarding
inaccessible system journals when run as a normal user.
-m, —merge
Show entries interleaved from all available journals,
including remote ones.
-b [ID][±offset],
—boot=[ID][±offset]
Show messages from a specific boot. This will add a match
for «_BOOT_ID=».
The argument may be empty, in which case logs for the current boot
will be shown.
If the boot ID is omitted, a positive offset will look up
the boots starting from the beginning of the journal, and an
equal-or-less-than zero offset will look up boots starting from the
end of the journal. Thus, 1 means the first boot found in the journal
in chronological order, 2 the second and so on; while -0 is
the last boot, -1 the boot before last, and so on. An empty
offset is equivalent to specifying -0, except when the current
boot is not the last boot (e.g. because —directory was specified to
look at logs from a different machine).
If the 32-character ID is specified, it may optionally be
followed by offset which identifies the boot relative to the one
given by boot ID. Negative values mean earlier boots and positive
values mean later boots. If offset is not specified, a value of zero
is assumed, and the logs for the boot given by ID are shown.
—list-boots
Show a tabular list of boot numbers (relative to the
current boot), their IDs, and the timestamps of the first and last message
pertaining to the boot.
-k, —dmesg
Show only kernel messages. This implies -b and
adds the match «_TRANSPORT=kernel».
-t, —identifier=SYSLOG_IDENTIFIER
Show messages for the specified syslog identifier
SYSLOG_IDENTIFIER.
This parameter can be specified multiple times.
-u,
—unit=UNIT|PATTERN
Show messages for the specified systemd unit UNIT
(such as a service unit), or for any of the units matched by PATTERN.
If a pattern is specified, a list of unit names found in the journal is
compared with the specified pattern and all that match are used. For each unit
name, a match is added for messages from the unit
(«_SYSTEMD_UNIT=UNIT«), along with additional matches for
messages from systemd and messages about coredumps for the specified unit.
This parameter can be specified multiple times.
—user-unit=
Show messages for the specified user session unit. This
will add a match for messages from the unit («_SYSTEMD_USER_UNIT=»
and «_UID=») and additional matches for messages from session
systemd and messages about coredumps for the specified unit.
This parameter can be specified multiple times.
-p, —priority=
Filter output by message priorities or priority ranges.
Takes either a single numeric or textual log level (i.e. between
0/»emerg» and 7/»debug»), or a range of numeric/text log
levels in the form FROM..TO. The log levels are the usual syslog log levels as
documented in syslog(3), i.e. «emerg» (0),
«alert» (1), «crit» (2),
«err» (3), «warning» (4),
«notice» (5), «info» (6),
«debug» (7). If a single log level is specified, all messages
with this log level or a lower (hence more important) log level are shown. If
a range is specified, all messages within the range are shown, including both
the start and the end value of the range. This will add «PRIORITY=»
matches for the specified priorities.
-c, —cursor=
Start showing entries from the location in the journal
specified by the passed cursor.
—after-cursor=
Start showing entries from the location in the journal
after the location specified by the passed cursor. The cursor is shown
when the —show-cursor option is used.
—show-cursor
The cursor is shown after the last entry after two
dashes:
The format of the cursor is private and subject to change.
-S, —since=, -U, —until=
Start showing entries on or newer than the specified
date, or on or older than the specified date, respectively. Date
specifications should be of the format «2012-10-30 18:17:16». If the
time part is omitted, «00:00:00» is assumed. If only the seconds
component is omitted, «:00» is assumed. If the date component is
omitted, the current day is assumed. Alternatively the strings
«yesterday», «today», «tomorrow» are understood,
which refer to 00:00:00 of the day before the current day, the current day, or
the day after the current day, respectively. «now» refers to the
current time. Finally, relative times may be specified, prefixed with
«-» or «+», referring to times before or after the current
time, respectively. For complete time and date specification, see
systemd.time(7). Note that —output=short-full prints timestamps
that follow precisely this format.
-F, —field=
Print all possible data values the specified field can
take in all entries of the journal.
-N, —fields
Print all field names currently used in all entries of
the journal.
—system, —user
Show messages from system services and the kernel (with
—system). Show messages from service of current user (with
—user). If neither is specified, show all messages that the user can
see.
-M, —machine=
Show messages from a running, local container. Specify a
container name to connect to.
-D DIR,
—directory=DIR
Takes a directory path as argument. If specified,
journalctl will operate on the specified journal directory DIR instead
of the default runtime and system journal paths.
—file=GLOB
Takes a file glob as an argument. If specified,
journalctl will operate on the specified journal files matching GLOB
instead of the default runtime and system journal paths. May be specified
multiple times, in which case files will be suitably interleaved.
—root=ROOT
Takes a directory path as an argument. If specified,
journalctl will operate on journal directories and catalog file hierarchy
underneath the specified directory instead of the root directory (e.g.
—update-catalog will create
ROOT/var/lib/systemd/catalog/database, and journal files under
ROOT/run/journal or ROOT/var/log/journal will be
displayed).
—new-id128
Instead of showing journal contents, generate a new
128-bit ID suitable for identifying messages. This is intended for usage by
developers who need a new identifier for a new message they introduce and want
to make recognizable. This will print the new ID in three different formats
which can be copied into source code or similar.
—header
Instead of showing journal contents, show internal header
information of the journal fields accessed.
—disk-usage
Shows the current disk usage of all journal files. This
shows the sum of the disk usage of all archived and active journal
files.
—vacuum-size=, —vacuum-time=,
—vacuum-files=
Removes archived journal files until the disk space they
use falls below the specified size (specified with the usual «K»,
«M», «G» and «T» suffixes), or all archived
journal files contain no data older than the specified timespan (specified
with the usual «s», «m», «h», «days»,
«months», «weeks» and «years» suffixes), or no
more than the specified number of separate journal files remain. Note that
running —vacuum-size= has only an indirect effect on the output shown
by —disk-usage, as the latter includes active journal files, while the
vacuuming operation only operates on archived journal files. Similarly,
—vacuum-files= might not actually reduce the number of journal files
to below the specified number, as it will not remove active journal files.
—vacuum-size=, —vacuum-time= and —vacuum-files= may be
combined in a single invocation to enforce any combination of a size, a time
and a number of files limit on the archived journal files. Specifying any of
these three parameters as zero is equivalent to not enforcing the specific
limit, and is thus redundant.
—list-catalog [128-bit-ID…]
List the contents of the message catalog as a table of
message IDs, plus their short description strings.
If any 128-bit-IDs are specified, only those entries are
shown.
—dump-catalog [128-bit-ID…]
Show the contents of the message catalog, with entries
separated by a line consisting of two dashes and the ID (the format is the
same as .catalog files).
If any 128-bit-IDs are specified, only those entries are
shown.
—update-catalog
Update the message catalog index. This command needs to
be executed each time new catalog files are installed, removed, or updated to
rebuild the binary catalog index.
—setup-keys
Instead of showing journal contents, generate a new key
pair for Forward Secure Sealing (FSS). This will generate a sealing key and a
verification key. The sealing key is stored in the journal data directory and
shall remain on the host. The verification key should be stored externally.
Refer to the Seal= option in journald.conf(5) for information on
Forward Secure Sealing and for a link to a refereed scholarly paper detailing
the cryptographic theory it is based on.
—force
When —setup-keys is passed and Forward Secure
Sealing (FSS) has already been configured, recreate FSS keys.
—interval=
Specifies the change interval for the sealing key when
generating an FSS key pair with —setup-keys. Shorter intervals
increase CPU consumption but shorten the time range of undetectable journal
alterations. Defaults to 15min.
—verify
Check the journal file for internal consistency. If the
file has been generated with FSS enabled and the FSS verification key has been
specified with —verify-key=, authenticity of the journal file is
verified.
—verify-key=
Specifies the FSS verification key to use for the
—verify operation.
—sync
Asks the journal daemon to write all yet unwritten
journal data to the backing file system and synchronize all journals. This
call does not return until the synchronization operation is complete. This
command guarantees that any log messages written before its invocation are
safely stored on disk at the time it returns.
—flush
Asks the journal daemon to flush any log data stored in
/run/log/journal into /var/log/journal, if persistent storage is enabled. This
call does not return until the operation is complete. Note that this call is
idempotent: the data is only flushed from /run/log/journal into
/var/log/journal once during system runtime, and this command exits cleanly
without executing any operation if this has already happened. This command
effectively guarantees that all data is flushed to /var/log/journal at the
time it returns.
—rotate
Asks the journal daemon to rotate journal files. This
call does not return until the rotation operation is complete.
-h, —help
Print a short help text and exit.
—version
Print a short version string and exit.
—no-pager
Do not pipe output into a pager.
EXIT STATUS
On success, 0 is returned; otherwise, a non-zero failure code is returned.
ENVIRONMENT
$SYSTEMD_PAGER
Pager to use when —no-pager is not given;
overrides $PAGER. If neither $SYSTEMD_PAGER nor $PAGER
are set, a set of well-known pager implementations are tried in turn,
including less(1) and more(1), until one is found. If no pager
implementation is discovered no pager is invoked. Setting this environment
variable to an empty string or the value «cat» is equivalent to
passing —no-pager.
$SYSTEMD_LESS
Override the options passed to less (by default
«FRSXMK»).
$SYSTEMD_LESSCHARSET
Override the charset passed to less (by default
«utf-8», if the invoking terminal is determined to be UTF-8
compatible).
EXAMPLES
Without arguments, all collected logs are shown unfiltered:
With one match specified, all entries with a field matching the
expression are shown:
journalctl _SYSTEMD_UNIT=avahi-daemon.service
If two different fields are matched, only entries matching both
expressions at the same time are shown:
journalctl _SYSTEMD_UNIT=avahi-daemon.service _PID=28097
If two matches refer to the same field, all entries matching
either expression are shown:
journalctl _SYSTEMD_UNIT=avahi-daemon.service _SYSTEMD_UNIT=dbus.service
If the separator «+» is used, two expressions may be
combined in a logical OR. The following will show all messages from the
Avahi service process with the PID 28097 plus all messages from the D-Bus
service (from any of its processes):
journalctl _SYSTEMD_UNIT=avahi-daemon.service _PID=28097 + _SYSTEMD_UNIT=dbus.service
Show all logs generated by the D-Bus executable:
journalctl /usr/bin/dbus-daemon
Show all kernel logs from previous boot:
Show a live log display from a system service apache.service:
SEE ALSO
systemd(1), systemd-journald.service(8), systemctl(1),
coredumpctl(1), systemd.journal-fields(7),
journald.conf(5), systemd.time(7)
NOTES
- 1.
- Journal Export Format
- 2.
- Journal JSON Format
- 3.
- Server-Sent Events
- 4.
- Message Catalog Developer Documentation
Журналы — это один из самых важных источников информации при возникновении любых ошибок в операционной системе Linux. Я это уже много раз говорил ранее и вот сказал ещё раз. Раньше в Linux для сохранения журналов сервисов использовался отдельный демон под названием syslogd. Но с приходом системы инициализации systemd большинство функций касающихся управления сервисами перешли под её управление. В том числе и управление логами.
Теперь для просмотра логов определенного сервиса или загрузки системы необходимо использовать утилиту journalctl. В этой статье мы разберем примеры использования journalctl, а также основные возможности этой команды и её опции. По сравнению с обычными файлами журналов, у journalctl есть несколько преимуществ. Все логи находятся в одном месте, они индексируются и структурируются, поэтому к ним можно получить доступ в нескольких удобных форматах.
Синтаксис команды очень простой. Достаточно выполнить команду без опций или передав ей нужные опции. Если утилита не выводит ничего, выполните её от имени суперпользователя:
journalctl опции
А теперь давайте разберем основные опции journalctl:
- —full, -l — отображать все доступные поля;
- —all, -a — отображать все поля в выводе full, даже если они содержат непечатаемые символы или слишком длинные;
- —pager-end, -e — отобразить только последние сообщения из журнала;
- —lines, -n — количество строк, которые нужно отображать на одном экране, по умолчанию 10;
- —no-tail — отображать все строки доступные строки;
- —reverse, -r — отображать новые события в начале списка;
- —output, -o — настраивает формат вывода лога;
- —output-fields — поля, которые нужно выводить;
- —catalog, -x — добавить к информации об ошибках пояснения, ссылки на документацию или форумы там, где это возможно;
- —quiet, -q — не показывать все информационные сообщения;
- —merge, -m — показывать сообщения из всех доступных журналов;
- —boot, -b — показать сообщения с момента определенной загрузки системы. По умолчанию используется последняя загрузка;
- —list-boots — показать список сохраненных загрузок системы;
- —dmesg, -k — показывает сообщения только от ядра. Аналог вызова команды dmesg;
- —identifier, -t — показать сообщения с выбранным идентификатором;
- —unit, -u — показать сообщения от выбранного сервиса;
- —user-unit — фильтровать сообщения от выбранной сессии;
- —priority, -p — фильтровать сообщения по их приоритету. Есть восемь уровней приоритета, от 0 до 7;
- —grep, -g — фильтрация по тексту сообщения;
- —cursor, -c — начать просмотр сообщений с указанного места;
- —since, -S, —until, -U — фильтрация по дате и времени;
- —field, -F — вывести все данные из выбранного поля;
- —fields, -N — вывести все доступные поля;
- —system — выводить только системные сообщения;
- —user — выводить только сообщения пользователя;
- —machine, -M — выводить сообщения от определенного контейнера;
- —header — выводить заголовки полей при выводе журнала;
- —disk-usage — вывести общий размер лог файлов на диске;
- —list-catalog — вывести все доступные подсказки для ошибок;
- —sync — синхронизировать все не сохраненные журналы с файловой системой;
- —flush — перенести все данные из каталога /run/log/journal в /var/log/journal;
- —rotate — запустить ротацию логов;
- —no-pager — выводить информацию из журнала без возможности листать страницы;
- -f — выводить новые сообщения в реальном времени, как в команде tail;
- —vacuum-time — очистить логи, давностью больше указанного периода;
- —vacuum-size — очистить логи, чтобы размер хранилища соответствовал указанному.
Горячие клавиши journalctl
По умолчанию информация лога выводится в формате, в котором её можно листать. Давайте разберем горячие клавиши, которые вы можете для этого использовать:
- Стрелка вниз, Enter, e или j — переместиться вниз на одну строку;
- Стрелка вверх, y или k — переместиться на одну строку вверх;
- Пробел — переместиться на одну страницу вниз;
- b — переместиться на одну страницу вверх;
- Стрелка вправо, стрелка влево — горизонтальна прокрутка;
- g — перейти на первую строку;
- G — перейти на последнюю строку;
- p — перейти на позицию нужного процента сообщений. Например, 50p перенесет курсор на середину вывода;
- / — поиск по журналу;
- n — найти следующее вхождение;
- N — предыдущее вхождение;
- q — выйти.
Теперь вы знаете основные опции команды и клавиши, с помощью которых можно ею управлять. Дальше небольшая шпаргалка journalctl.
Шпаргалка по journalctl
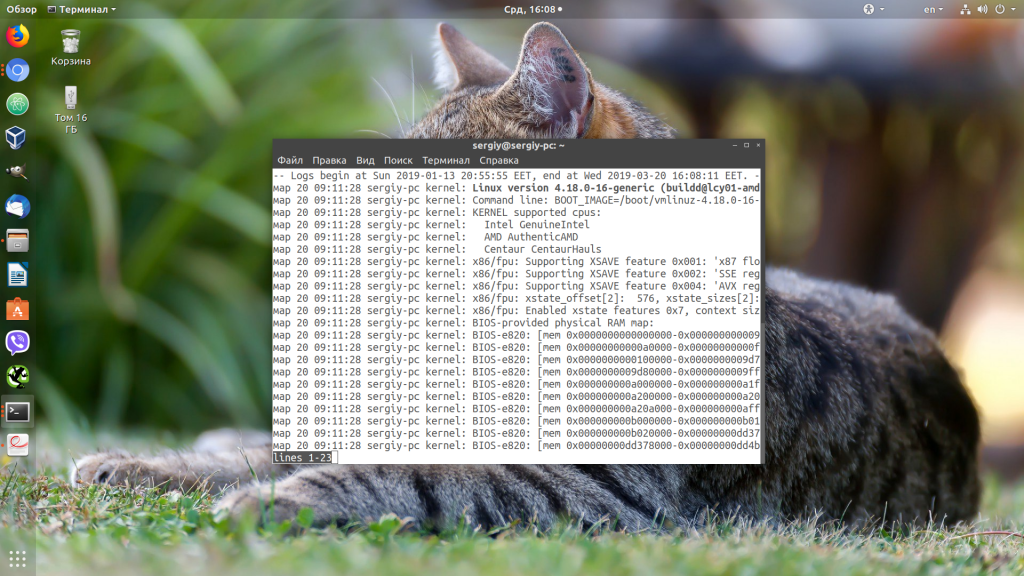
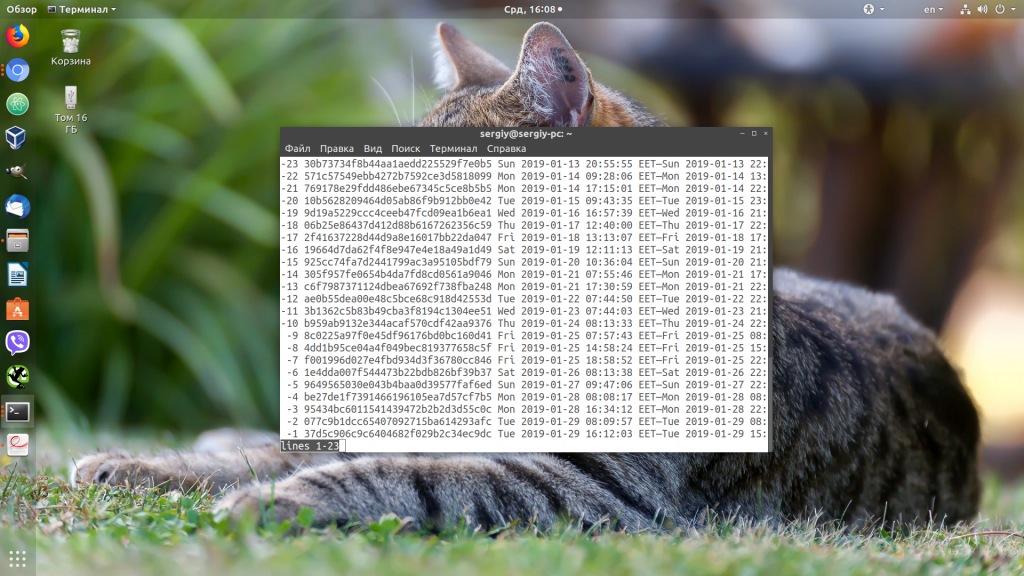
Вывод journalctl представляет из себя цельный список всех сохраненных сообщений. Если вы запустите команду journalctl без параметров, то получите самые первые сообщения, которые были сохранены. В моем случае это данные за 13 января:
sudo journalctl

Чтобы найти именно то, что вам нужно, необходимо научится перемещаться по этому списку. Формат вывода лога довольно простой:
янв 13 20:55:55 sergiy-pc kernel: Linux version 4.15.0-43-generic
- янв 13 20:55:55 — дата и время события;
- sergiy-pc — хост, на котором произошло событие;
- kernel — источник события, обычно это программа или сервис. В данном случае ядро;
- Linux version 4.15.0-43-generic — само сообщение.
Давайте перейдем к примерам фильтрации и перемещения.
1. Просмотр логов сервисов
Самый частый случай использования journalctl — это когда вы пытаетесь запустить какой-либо сервис с помощью systemd, он не запускается и systemd выдает вам такое сообщение подобного содержания: Failed to start service use journalctl -xe for details. Система сама предлагает вам какую команду надо выполнить:
sudo journalctl -xe
Как вы помните из опций, эта команда отображает последние сообщения в журнале и добавляет к ним дополнительную информацию, если она есть. Учитывая, что последнее, что мы делали — был наш сервис, то здесь будут сообщения от него и вы быстро сможете понять почему он не запускается.
Чтобы отфильтровать сообщения только от определенного сервиса можно использовать опцию -u. Например:
sudo journalctl -eu apache2.service
2. Просмотр логов в режиме tail
С помощью опции -f можно указать утилите, что необходимо выводить новые сообщения в реальном времени:
sudo journalctl -f
В этом режиме less не поддерживается, поэтому для выхода нажмите сочетание клавиш Ctrl+C.
3. Просмотр логов загрузки
В логе journalctl содержатся все логи, в том числе и логи загрузки. Для того чтобы открыть лог последней загрузки используйте опцию -b:
sudo journalctl -b
Посмотреть список всех сохраненных загрузок можно командой:
sudo journalctl -list-boots
Теперь, чтобы посмотреть сообщения для нужной загрузки используйте её идентификатор:
sudo journalctl -b 37d5c906c9c6404682f029b2c34ec9dc
4. Фильтрация по дате
С помощью опции —since вы можете указать дату и время, начиная с которой нужно отображать логи:
sudo journalctl --since "2019-01-20 15:10:10"
Опция —until помогает указать по какую дату вы хотите получить информацию:
sudo journalctl -e --until "2019-01-20 15:05:50"
Или сразу скомбинируем две эти опции чтобы получить логи за нужный период:
sudo journalctl --since "2019-01-20 15:10:10" --until "2019-01-20 15:05:50"
Кроме даты в формате YYYY-MM-DD в этих опциях можно использовать такие слова, как yesterday, today, и tomorrow. Также допустимы конструкции 1 day ago (один день назад) или 3 hours ago (три часа назад). Ещё можно использовать знаки + и -. Например -1h30min будет означать полтора часа назад.
5. Журнал ядра
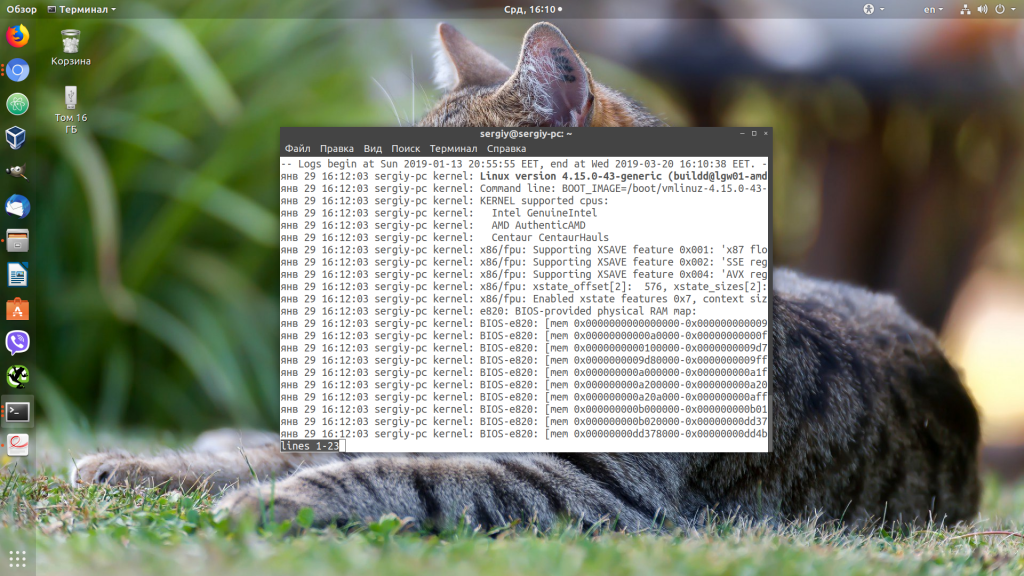
Если вы хотите посмотреть только сообщения ядра используйте опцию -k:
sudo journalctl -ek
6. Настройка формата вывода
По умолчанию journalctl выводит информацию с помощью утилиты less, в которой вы можете её удобно листать и просматривать. Но формат вывода можно изменить:
- short — используется по умолчанию;
- verbose — также, как и short, только выводится намного больше информации;
- json — вывод в формате json, одна строка лога в одной строке вывода;
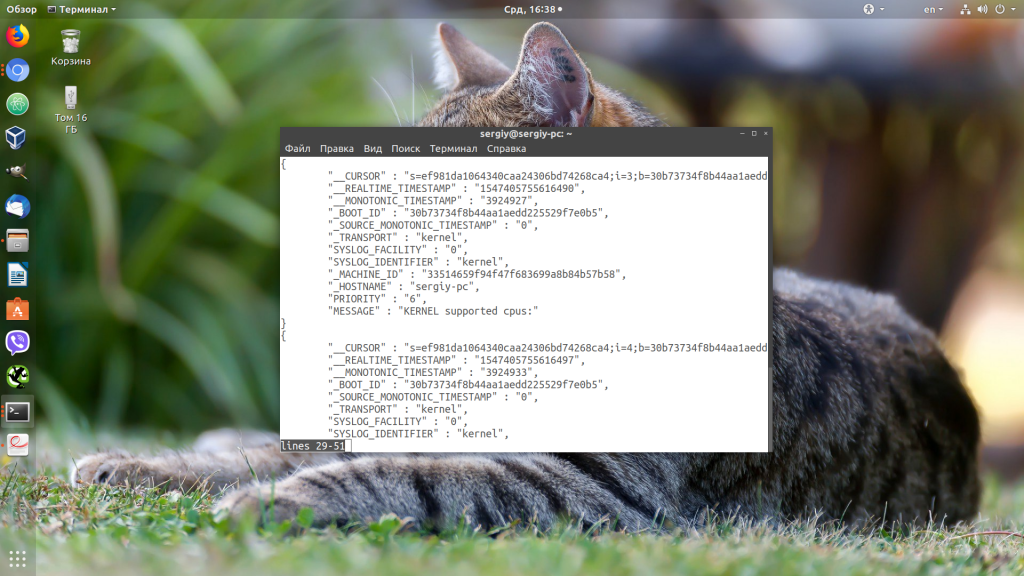
- json-pretty — форматированный вывод json для более удобного восприятия;
- cat — отображать только сообщения, без метаданных.
Чтобы указать нужный формат используйте опцию -o. Например:
sudo journalctl -o json-pretty
Или:
sudo journalctl -eo json-pretty
7. Очистка логов
Сначала нужно посмотреть сколько ваши логи занимают на диске. Для этого используйте такую команду:
sudo journalctl --disk-usage

Чтобы уменьшить размер лога можно использовать опцию —vacuum-size. Например, если вы хотите, чтобы ваши файлы журналов занимали на диске не более 2 Гб, выполните команду:
sudo journalctl --vacuum-size=2G
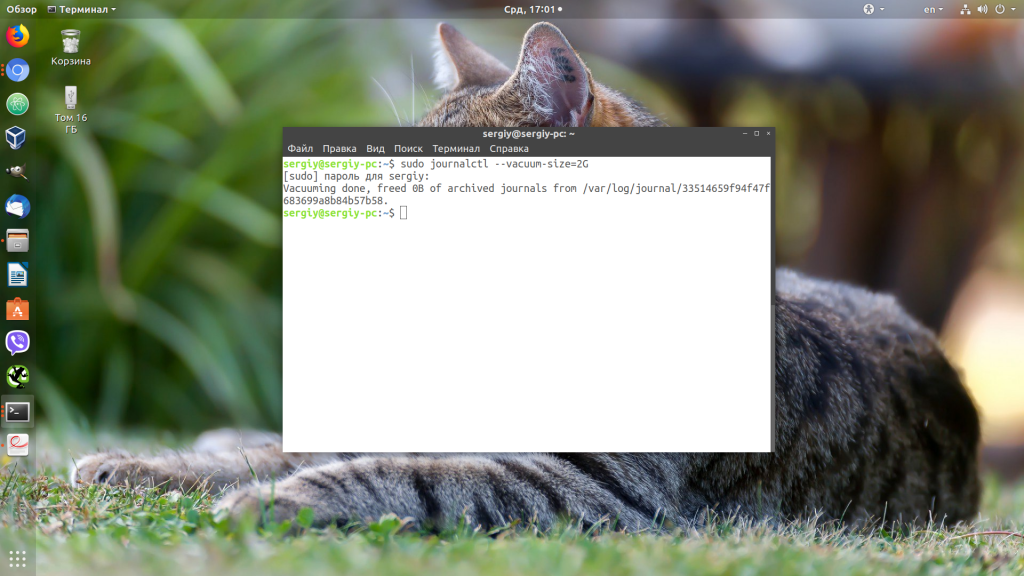
Теперь старые логи будут удалены, пока общий объем хранилища не будет составлять 2 гигабайта. Также можно удалять логи по времени. Для этого используется опция —vacuum-time. Например, оставим только логи за последний год:
journalctl --vacuum-time=1years
Выводы
В этой статье мы разобрали как пользоваться journalctl в Linux. Наличие этой утилиты в системе не означает, что теперь вы не можете пользоваться обычными файлами логов. Большинство сервисов как и раньше пишут свои основные логи в файлы, а в лог journalctl пишутся сообщения при старте сервисов, а также различные системные сообщения.
Обнаружили ошибку в тексте? Сообщите мне об этом. Выделите текст с ошибкой и нажмите Ctrl+Enter.

Статья распространяется под лицензией Creative Commons ShareAlike 4.0 при копировании материала ссылка на источник обязательна .
где посмотреть журнал ошибок при загрузке?
Автор andrei186, 11 января 2016, 21:28:45
« назад — далее »
0 Пользователи и 1 гость просматривают эту тему.
Деб-8 отказался загружаться, выдав несколько экранов ошибок. В конце попросил рутовый пароль, чтобы произвести какой-то maintenance. С этим паролем позволил войти в командную строку.
Где теперь я могу посмотреть эти ошибки?
Пробовал в /var/log/syslog — файл нескончаемой длины, и обрывается на 28/12/2015
/var/log/dmesg — то же самое
/var/log/boot.log отсутствует
Цитата: Yrii от 11 января 2016, 21:51:45
Цитата: andrei186 от 11 января 2016, 21:28:45Где теперь я могу посмотреть эти ошибки?
Например можно воспользоваться новой «фишкой»:
journalctl -b -p err
эта команда вернула, что такая команда не найдена.
Гугл учит, что journalctl есть часть пакета systemd
apt-get install systemd ответила одним предупреждением и двумя ошибками:
W: not using locking for read only lock file /var/lib/dpkg/lock
E: unable to write to /var/cache/apt
E: the package lists of status file could not be parced or opened
Все же можно посмотреть эти журналы ошибок без фишек?
andrei186, У тебя Debian 8, значит systemd (при установке по умолчанию) у тебя присутствует (опять же, если сам не удалял)
journalctl -b -p err надо запускать с правами root (так же как и команду установки пакетов  )
)
ЦитироватьВсе же можно посмотреть эти журналы ошибок без фишек?
Например тут /var/log/syslog
Цитата: Yrii от 14 января 2016, 20:51:22
andrei186, У тебя Debian 8, значит systemd (при установке по умолчанию) у тебя присутствует (опять же, если сам не удалял)journalctl -b -p errнадо запускать с правами root (так же как и команду установки пакетов)
ЦитироватьВсе же можно посмотреть эти журналы ошибок без фишек?
Например тут /var/log/syslog
спасибо, но в моем первоначальном посте я сообщил, что я был допущен до командной строки как root, и что я уже смотрел /var/log/syslog, записи в котором заканчиваются на 28/12/2015, а ошибки, о которых речь, начались 11 января 2016.
Как я сказал, этот файл неимоверной длины — может у него есть ограничение по размеру, и он не принимает новых записей, и тогода его надо прчистить?
Цитата: andrei186 от 14 января 2016, 21:09:47Как я сказал, этот файл неимоверной длины — может у него есть ограничение по размеру, и он не принимает новых записей, и тогода его надо прчистить?
По умолчанию он сам должен произвести ротацию логов.
Цитата: andrei186 от 14 января 2016, 20:30:38
эта команда вернула, что такая команда не найдена.
Постарайтесь писать дословно, что пишет. (Просто может быть вы что-то не так поняли /перевели. Всякое бывает.)
Посмотрите ещё файл /var/log/kern.log
- Русскоязычное сообщество Debian GNU/Linux
-
►
-
►
Общие вопросы -
►
где посмотреть журнал ошибок при загрузке?
What are Linux log files?
Log files are simply plain text files that contain the set of records, events, or messages about the server, applications, and services running on your Linux operating system. They are used by system administrators for troubleshooting purposes whenever an issue arises.
In Linux, the log files are generally categorized into the following.
- Application logs
- Event logs
- Service logs
- System logs
There is a lot of log files in Linux and they are located at /var/log/ directory. Monitoring all of them is a tedious task. However, the following critical files must be monitored.
- /var/log/syslog
- /var/log/messages
- /var/log/auth.log
- /var/log/secure
- /var/log/boot.log
- /var/log/dmesg
- /var/log/kern.log
- /var/log/faillog
- /var/log/cron
- /var/log/mail.log
- /var/log/apache2/error.log
- /var/log/mysql.log
In this article, we are going to explore various methods that can be used to view or monitor log files in real-time. We have executed all the commands on Debian 10.
Prerequisites
You need to have the following for this tutorial,
- A user account with root privileges
Viewing log files
Using tail command
The tail is one of the widely used commands for viewing a log. It prints the last few lines of the log file on a console, by default 10 lines.
The general syntax of the command is as follows.
tail <path of log file>
For example,
tail /var/log/syslog
Below is the sample output showing the last 10 lines of a syslog file.

However, if you want to view the specific lines of the end of the log file say 5 lines, you can use the -n option as follows.
tail -n 5 /var/log/syslog
Below is the sample output.

If you want to follow a log file and want to print the new messages as it is logged in real-time, you can use the -f option along with the above example of commands.
tail -f -n 5 /var/log/syslog

As soon as a new line is added to the log file, it gets printed along with its 4 above lines.
If you want to close the terminal, press ctrl + c from the keyboard.
Using multitail command
With the help of multitail command, you can monitor and view the content of multiple log files in real-time on a console in single window. The multitail command doesn’t come built-in Debian 10. Therefore, open up the terminal and issue the following command with root privileges to install it.
apt-get install multitail
Below is the sample output.

The general syntax of multitail command is as follows,
multitail filename 1 filename 2
Suppose you have two log files /var/log/syslog and /var/log/kern.log and you want to view their contents on the console using multitail, the complete command should look like the following.
multitail /var/log/syslog /var/log/kern.log
Below is the sample output.

You can monitor the contents of multiple log files in real-time with the help of this command. For instance, the below screenshot shows the content of four log files /var/log/syslog, /var/log/kern.log, /var/log/daemon.log and var/log/messages.

By default, multitail command shows the contents of log files horizontally. If you want to view the files vertically in columns, you can use the -s switches as follows.
Suppose you want to view the contents of log files vertically in two columns, the complete command should look like the following.
multitail -s 2 /var/log/syslog, /var/log/kern.log, /var/log/daemon.log and var/log/messages
Below is the sample output.

You can also navigate through the files. Press ‘b’ from the keyboard and scroll through to choose your desired log file. You can view the last 100 lines of your chosen file.
Below are the sample outputs.


Press Ctrl + g to abort and return to multiple log files window.
You can also give different colors to log files using the ci parameter so that you can easily differentiate between them. Following is a good example,
multitail -ci green /var/log/syslog -ci blue /var/log/messages
Below is the sample output.

Multitail command offers a lot. Press ‘ h’ from the keyboard for help while the command is running.

Using lnav command
The lnav command is similar to multitail command and shows the content of multiple log files in a single window. To install it on Debian, open up the terminal and issue the following command with root privileges.
apt-get update lnav
Press ‘y’ from the keyboard when prompted. Wait for the command to finish.

Unlike multitail or other commands, the lnav command merges the content of log files and shows each line based on their date in a single window.
Below is the sample file. You can scroll through the window using up, down, etc keys of your keyboard.

The general syntax of the command is as follows,
lnav <name and path of file 1> <name and path of file 2>
Suppose, you want to view the log of syslog and daemon.log. Execute the following command on terminal.
lnav /var/log/syslog /var/log/messages
Below is the sample output.

If you do not specify the file with the command, by default it opens the syslog file.
Execute the following command.
lnav
Below is the sample output.

You can also search through the log by pressing / from your keyboard when a command is running. After pressing the / key, type your desired string you want to search and hit Enter key from the keyboard.
Suppose I am searching the string ‘DHCPACK’ and it is highlighted in the window.
Below is the sample output.

You can also view the compressed log files (zip, gzip, bzip) by using -r option. Below is the complete syntax.
lnav -r <zip file name>
Using less command
Less is another command which is used to monitor the output of a log file.
Below is the complete syntax of the command.
less +F <path of file>
For example, if you want to monitor the syslog file at the path /var/log/syslog, the complete command should look like the following.
less +F /var/log/syslog
Below is the sample output.
