
Improve Article
Save Article
Like Article
Improve Article
Save Article
Like Article
What is Segmentation Error ?
– It is the runtime error caused because of the memory access violation. For Eg :-Stackoverflow, read violation etc..
We often face this problem when working out with pointers in c++/c.
In this example we will see how to find the segmentation error in the program. We will find which lines causes the segmentation fault error.
Note :- I have used Linux distro – Ubuntu for this demonstration.
So, Consider the following snippet of C++ Code.
#include <iostream>
using namespace std;
int main()
{
int* p = NULL;
*p = 1;
cout << *p;
return 0;
}
How to find that error using gdb?
Let’s say your file name is saved as Program1.cpp. Head our to your terminal (Be in the directory in which this Program1.cpp is available)
Step 1: Compile it.$ gcc -g Program1.cpp (in my case).
Step 2: Run it.$ ./a.out (it is Object File)
If it shows Segmentation fault (core dumped) then follow following steps.
Step 3:Debug it$ gdb ./a.out core
Your output will look like something this:
————————————————————————————
GNU gdb (Ubuntu 8.1-0ubuntu3) 8.1.0.20180409-git
Copyright (C) 2018 Free Software Foundation, Inc.
License GPLv3+: GNU GPL version 3 or later
This is free software: you are free to change and redistribute it.
There is NO WARRANTY, to the extent permitted by law. Type "show copying"
and "show warranty" for details.
This GDB was configured as "x86_64-linux-gnu".
Type "show configuration" for configuration details.
For bug reporting instructions, please see:
.
Find the GDB manual and other documentation resources online at:
.
For help, type "help".
Type "apropos word" to search for commands related to "word"...
Reading symbols from ./a.out...done.
/home/logarithm/Desktop/Test Case/Miccl/core: No such file or directory.
(gdb)
————————————————————————————
Then just type r and press the enter key .
The output will be something like this showing the erroneous statement.
———————————————————————————–
(gdb) r
Starting program: /home/logarithm/Desktop/Test Case/Miccl/a.out
Program received signal SIGSEGV, Segmentation fault.
0x00005555555547de in main () at Sege.cpp:8
8 *p=1;
(gdb)
————————————————————————————
Now you have got the line that causes segmentation error.
Exit from debugger and correct the program.
For exiting type quit and press enter.
———————————————————————————–
(gdb) quit
A debugging session is active.
Inferior 1 [process 3617] will be killed.
Quit anyway? (y or n) y
———————————————————————————–
So, wow you have resolved the head torturing segmentation fault.
Last Updated :
03 Sep, 2018
Like Article
Save Article
The segmentation fault, also known as segfault, is a type of computer error that occurs whenever an unexpected condition causes the processor to attempt to access a memory location that’s outside its own program storage area. The term “segmentation” refers to a memory protection mechanism used in virtual memory operating systems.
This specific error arises because data is typically shared on a system using different memory sections, and the program storage space is shared among applications.
Segmentation faults are usually triggered by an access violation, which occurs when the CPU attempts to execute instructions outside its memory area or tries to read or write into some reserved address that does not exist. This action results in halting the current application and generates an output known as Segmentation Fault.
#1. What are the Symptoms of Segmentation Fault?
The symptoms of segmentation faults may vary depending on how and where they’re generated. Typically, this error is generated due to one of the following conditions:
#a. Dereferencing a null pointer
Programming languages offer references, which are pointers that identify where in memory an item is located. A null pointer is a special pointer that doesn’t point to any valid memory location. Dereferencing (accessing) null pointer results in segmentation faults or null pointer exceptions.
/**
 * @file main.c
 * @author freecoder
 * @brief this program allow to handle a segmentation fault error
 *
 * @version 1.0
 * @date 8 Jan. 2022
 *
 * @copyright Copyright (c) 2022
 *
 */
#include <stdio.h>

/* main program entry */
int main(int argc, char **argv)
{
	/* local variables */
	unsigned int *puiPointer = NULL;
	/* body program */
	*puiPointer = 20;
	return 0;
}
after compiling and running the program with the gdb command, the segmentation fault error appears:
➜  Article-XX gcc -g main.c -o main
➜  Article-XX ./main
[1]    7825 segmentation fault  ./main
➜  Article-XX gdb ./main
GNU gdb (Debian 10.1-1.7) 10.1.90.20210103-git
Copyright (C) 2021 Free Software Foundation, Inc.
License GPLv3+: GNU GPL version 3 or later <http://gnu.org/licenses/gpl.html>
This is free software: you are free to change and redistribute it.
There is NO WARRANTY, to the extent permitted by law.
Type "show copying" and "show warranty" for details.
This GDB was configured as "x86_64-linux-gnu".
Type "show configuration" for configuration details.
For bug reporting instructions, please see:
<https://www.gnu.org/software/gdb/bugs/>.
Find the GDB manual and other documentation resources online at:
    <http://www.gnu.org/software/gdb/documentation/>.
For help, type "help".
Type "apropos word" to search for commands related to "word"...
Reading symbols from ./main...
(gdb) start
Temporary breakpoint 1 at 0x401111: file main.c, line 20.
Starting program: /home/others/Article-XX/main
warning: Error disabling address space randomization: Operation not permitted
Temporary breakpoint 1, main (argc=1, argv=0x7ffc9c096258) at main.c:20
20              unsigned int *puiPointer = NULL;
(gdb) list
15
16      /* main program entry */
17      int main(int argc, char **argv)
18      {
19              /* local variables */
20              unsigned int *puiPointer = NULL;
21
22              /* body program */
23
24              *puiPointer = 20;
(gdb) s
24              *puiPointer = 20;
(gdb) s
Program received signal SIGSEGV, Segmentation fault.
0x000000000040111d in main (argc=1, argv=0x7ffc9c096258) at main.c:24
24              *puiPointer = 20;
(gdb) 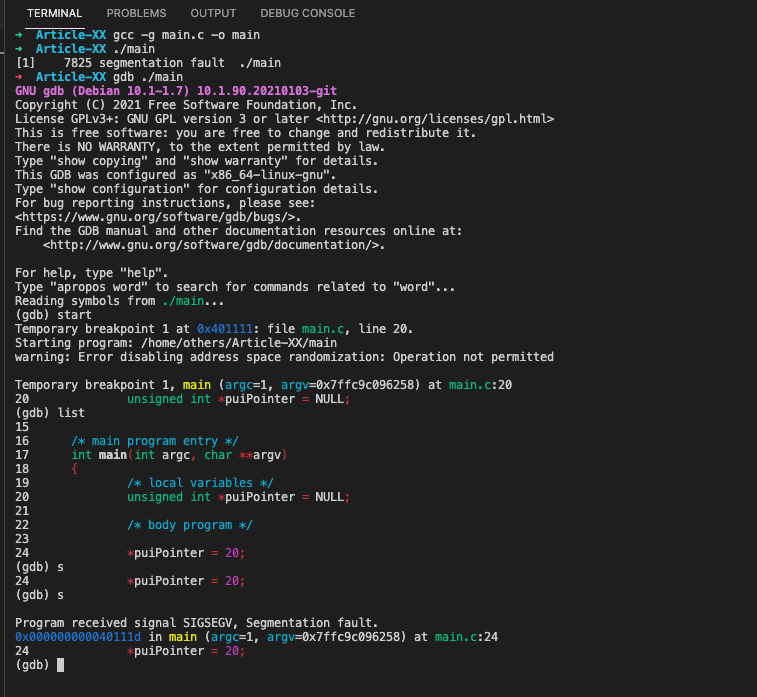
#b. Trying to access memory not initialized
Programs using uninitialized variables may crash when attempting to access uninitialized memory or may expose data stored in the uninitialized variables by writing to them. Also in the case when the program attempts to read or write to an area of memory not allocated with malloc(), calloc() or realloc().
An example of a simple segmentation fault is trying to read from a variable before it has been set:
/**
 * @file main.c
 * @author freecoder
 * @brief this program allow to handle a segmentation fault error
 *
 * @version 1.0
 * @date 8 Jan. 2022
 *
 * @copyright Copyright (c) 2022
 *
 */
#include <stdio.h>

/* main program entry */
int main(int argc, char **argv)
{
	/* local variables */
	unsigned int *puiPointer;
	/* body program */
	*puiPointer = 20;
	return 0;
}
In this case, the pointer puiPointer will be pointing to a random location in memory, so when the program attempts to read from it (by dereferencing *puiPointer), a segmentation fault will be triggered:
➜  Article-XX gcc -g main.c -o main
➜  Article-XX gdb ./main
GNU gdb (Debian 10.1-1.7) 10.1.90.20210103-git
Copyright (C) 2021 Free Software Foundation, Inc.
License GPLv3+: GNU GPL version 3 or later <http://gnu.org/licenses/gpl.html>
This is free software: you are free to change and redistribute it.
There is NO WARRANTY, to the extent permitted by law.
Type "show copying" and "show warranty" for details.
This GDB was configured as "x86_64-linux-gnu".
Type "show configuration" for configuration details.
For bug reporting instructions, please see:
<https://www.gnu.org/software/gdb/bugs/>.
Find the GDB manual and other documentation resources online at:
    <http://www.gnu.org/software/gdb/documentation/>.
For help, type "help".
Type "apropos word" to search for commands related to "word"...
Reading symbols from ./main...
(gdb) start
Temporary breakpoint 1 at 0x401111: file main.c, line 24.
Starting program: /home/others/Article-XX/main
warning: Error disabling address space randomization: Operation not permitted
Temporary breakpoint 1, main (argc=1, argv=0x7fff6df4f038) at main.c:24
24              *puiPointer = 20;
(gdb) list
19              /* local variables */
20              unsigned int *puiPointer;
21
22              /* body program */
23
24              *puiPointer = 20;
25
26              return 0;
27      }
(gdb) s
Program received signal SIGSEGV, Segmentation fault.
0x0000000000401115 in main (argc=1, argv=0x7fff6df4f038) at main.c:24
24              *puiPointer = 20;
(gdb) 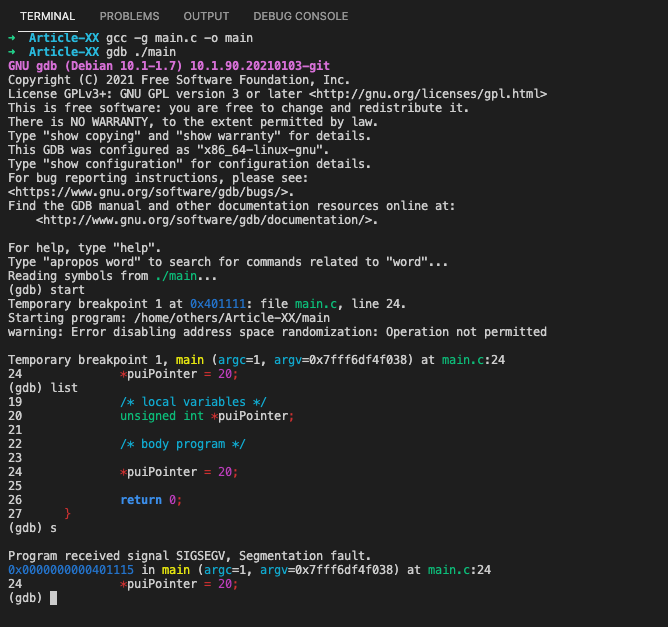
#c. Trying to access memory out of bounds for the program
In most situations, if a program attempts to access (read or write) memory outside of its boundaries, a segmentation fault error will occur. A code example of a simple segmentation fault error is below:
/**
 * @file main.c
 * @author freecoder
 * @brief this program allow to handle a segmentation fault error
 *
 * @version 1.0
 * @date 8 Jan. 2022
 *
 * @copyright Copyright (c) 2022
 *
 */
#include <stdio.h>

/* main program entry */
int main(int argc, char **argv)
{
	/* local variables */
	unsigned int uiArray[20];
	/* body program */
	uiArray[5000] = 1;
	return 0;
}
As shown bellow, the segmentation fault occurs after executing the out of bounds statement:
➜  Article-XX gcc -g main.c -o main
➜  Article-XX gdb ./main
GNU gdb (Debian 10.1-1.7) 10.1.90.20210103-git
Copyright (C) 2021 Free Software Foundation, Inc.
License GPLv3+: GNU GPL version 3 or later <http://gnu.org/licenses/gpl.html>
This is free software: you are free to change and redistribute it.
There is NO WARRANTY, to the extent permitted by law.
Type "show copying" and "show warranty" for details.
This GDB was configured as "x86_64-linux-gnu".
Type "show configuration" for configuration details.
For bug reporting instructions, please see:
<https://www.gnu.org/software/gdb/bugs/>.
Find the GDB manual and other documentation resources online at:
    <http://www.gnu.org/software/gdb/documentation/>.
For help, type "help".
Type "apropos word" to search for commands related to "word"...
Reading symbols from ./main...
(gdb) start
Temporary breakpoint 1 at 0x401111: file main.c, line 23.
Starting program: /home/others/Article-XX/main
warning: Error disabling address space randomization: Operation not permitted
Temporary breakpoint 1, main (argc=1, argv=0x7ffdb68620f8) at main.c:23
23              uiArray[5000] = 1;
(gdb) list
18      {
19              /* local variables */
20              unsigned int uiArray[20];
21
22              /* body program */
23              uiArray[5000] = 1;
24
25              return 0;
26      }
(gdb) s
Program received signal SIGSEGV, Segmentation fault.
main (argc=1, argv=0x7ffdb68620f8) at main.c:23
23              uiArray[5000] = 1;
(gdb) 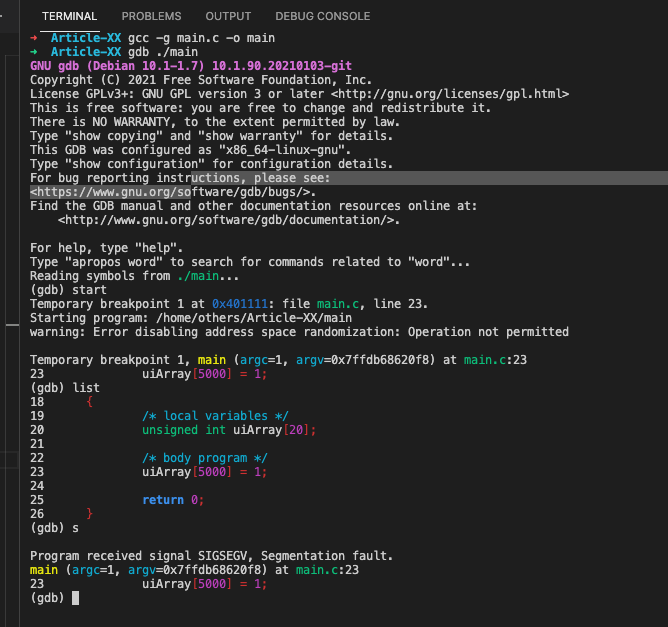
#d. Trying to modify string literals
/**
 * @file main.c
 * @author freecoder
 * @brief this program allow to handle a segmentation fault error
 *
 * @version 1.0
 * @date 8 Jan. 2022
 *
 * @copyright Copyright (c) 2022
 *
 */
#include <stdio.h>

/* main program entry */
int main(int argc, char **argv)
{
	/* local variables */
	char* pucString = "Sample String 1";
	/* body program */
	pucString[14] = '2';
	return 0;
}
As shown bellow, we got a segmentation error because the compiler put the string constant “Sample String 1” in read-only memory while trying to modify the contents of that memory which fails as a result:
➜  Article-XX gcc -g main.c -o main
➜  Article-XX gdb ./main
GNU gdb (Debian 10.1-1.7) 10.1.90.20210103-git
Copyright (C) 2021 Free Software Foundation, Inc.
License GPLv3+: GNU GPL version 3 or later <http://gnu.org/licenses/gpl.html>
This is free software: you are free to change and redistribute it.
There is NO WARRANTY, to the extent permitted by law.
Type "show copying" and "show warranty" for details.
This GDB was configured as "x86_64-linux-gnu".
Type "show configuration" for configuration details.
For bug reporting instructions, please see:
<https://www.gnu.org/software/gdb/bugs/>.
Find the GDB manual and other documentation resources online at:
    <http://www.gnu.org/software/gdb/documentation/>.
For help, type "help".
Type "apropos word" to search for commands related to "word"...
Reading symbols from ./main...
(gdb) start
Temporary breakpoint 1 at 0x401111: file main.c, line 20.
Starting program: /home/others/Article-XX/main
warning: Error disabling address space randomization: Operation not permitted
Temporary breakpoint 1, main (argc=1, argv=0x7ffc2ea212e8) at main.c:20
20              char* pucString = "Sample String 1";
(gdb) list
15
16      /* main program entry */
17      int main(int argc, char **argv)
18      {
19              /* local variables */
20              char* pucString = "Sample String 1";
21
22              /* body program */
23              pucString[14] = '2';
24
(gdb) n
23              pucString[14] = '2';
(gdb)
Program received signal SIGSEGV, Segmentation fault.
main (argc=1, argv=0x7ffc2ea212e8) at main.c:23
23              pucString[14] = '2';
(gdb) 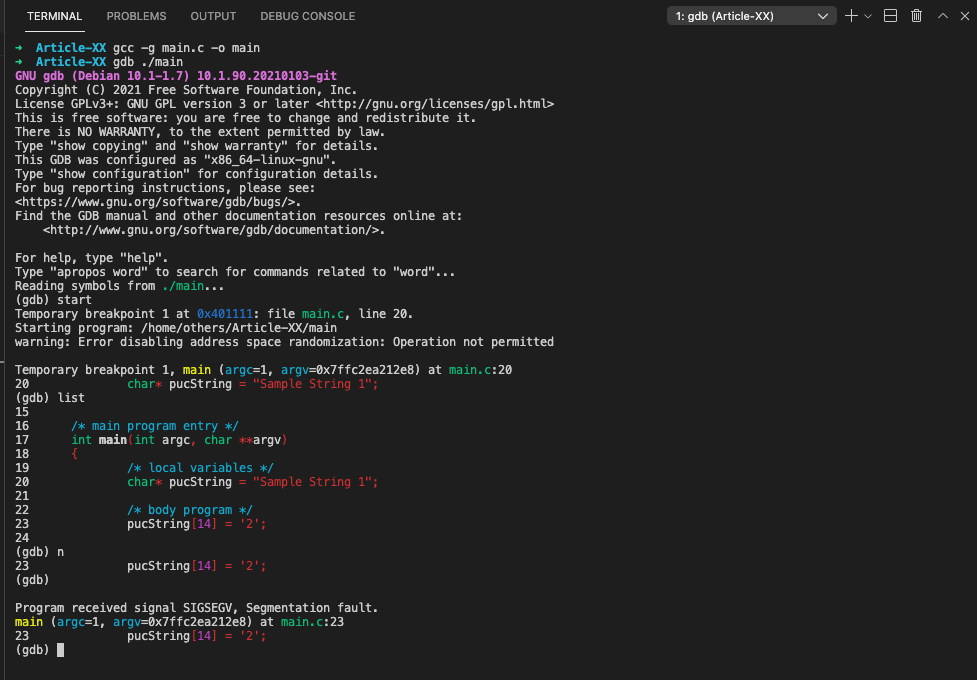
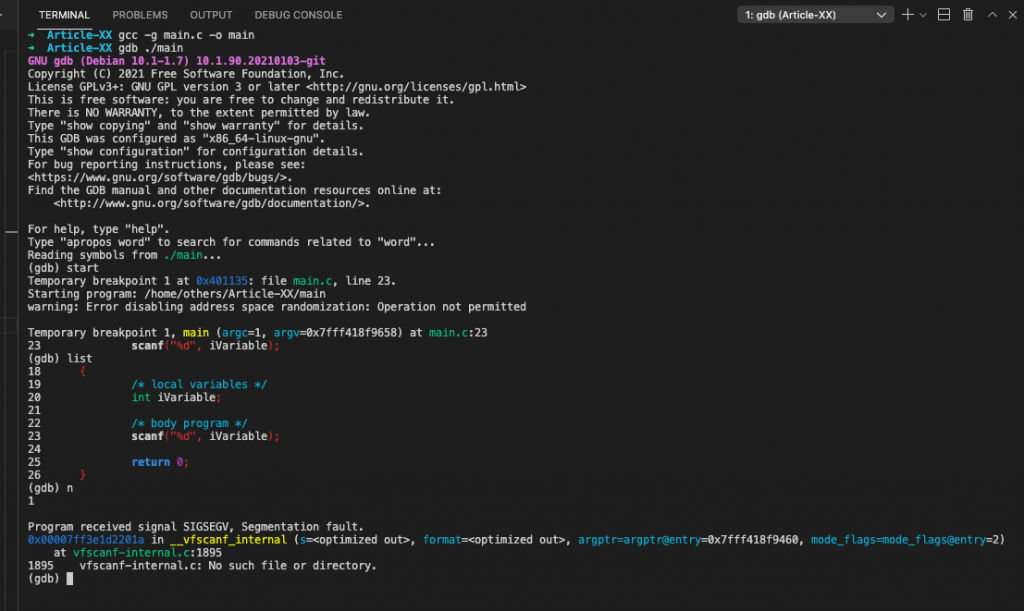
#e. Using variable’s value as an address
A segmentation fault occurs when accidentally you are using a variable’s value as an address as you can see through the code example bellow:
/**
 * @file main.c
 * @author freecoder
 * @brief this program allow to handle a segmentation fault error
 *
 * @version 1.0
 * @date 8 Jan. 2022
 *
 * @copyright Copyright (c) 2022
 *
 */
#include <stdio.h>

/* main program entry */
int main(int argc, char **argv)
{
	/* local variables */
	int iVariable;
	/* body program */
	scanf("%d", iVariable);
	return 0;
}
As shown in the terminal consol bellow, the segmentation occurs after the scans statement:
➜  Article-XX gcc -g main.c -o main
➜  Article-XX gdb ./main
GNU gdb (Debian 10.1-1.7) 10.1.90.20210103-git
Copyright (C) 2021 Free Software Foundation, Inc.
License GPLv3+: GNU GPL version 3 or later <http://gnu.org/licenses/gpl.html>
This is free software: you are free to change and redistribute it.
There is NO WARRANTY, to the extent permitted by law.
Type "show copying" and "show warranty" for details.
This GDB was configured as "x86_64-linux-gnu".
Type "show configuration" for configuration details.
For bug reporting instructions, please see:
<https://www.gnu.org/software/gdb/bugs/>.
Find the GDB manual and other documentation resources online at:
    <http://www.gnu.org/software/gdb/documentation/>.
For help, type "help".
Type "apropos word" to search for commands related to "word"...
Reading symbols from ./main...
(gdb) start
Temporary breakpoint 1 at 0x401135: file main.c, line 23.
Starting program: /home/others/Article-XX/main
warning: Error disabling address space randomization: Operation not permitted
Temporary breakpoint 1, main (argc=1, argv=0x7fff418f9658) at main.c:23
23              scanf("%d", iVariable);
(gdb) list
18      {
19              /* local variables */
20              int iVariable;
21
22              /* body program */
23              scanf("%d", iVariable);
24
25              return 0;
26      }
(gdb) n
1
Program received signal SIGSEGV, Segmentation fault.
0x00007ff3e1d2201a in __vfscanf_internal (s=<optimized out>, format=<optimized out>, [email protected]=0x7fff418f9460, [email protected]=2)
    at vfscanf-internal.c:1895
1895    vfscanf-internal.c: No such file or directory.
(gdb)
#f. Stack overflow
The segmentation fault error may occur if the call stack pointer exceeds the stack bound in case of an infinite recursive function call:
/**
 * @file main.c
 * @author freecoder
 * @brief this program allow to handle a segmentation fault error
 *
 * @version 1.0
 * @date 8 Jan. 2022
 *
 * @copyright Copyright (c) 2022
 *
 */
#include <stdio.h>

/* main program entry */
int main(void)
{
	/* local variables */
	/* body program */
	main();
	return 0;
}
As shown bellow, the segmentation fault error happened, due to a stack oveflow after calling the main function:
➜  Article-XX gcc -g main.c -o main
➜  Article-XX gdb ./main
GNU gdb (Debian 10.1-1.7) 10.1.90.20210103-git
Copyright (C) 2021 Free Software Foundation, Inc.
License GPLv3+: GNU GPL version 3 or later <http://gnu.org/licenses/gpl.html>
This is free software: you are free to change and redistribute it.
There is NO WARRANTY, to the extent permitted by law.
Type "show copying" and "show warranty" for details.
This GDB was configured as "x86_64-linux-gnu".
Type "show configuration" for configuration details.
For bug reporting instructions, please see:
<https://www.gnu.org/software/gdb/bugs/>.
Find the GDB manual and other documentation resources online at:
    <http://www.gnu.org/software/gdb/documentation/>.
For help, type "help".
Type "apropos word" to search for commands related to "word"...
Reading symbols from ./main...
(gdb) start
Temporary breakpoint 1 at 0x40110a: file main.c, line 22.
Starting program: /home/others/Article-XX/main
warning: Error disabling address space randomization: Operation not permitted
Temporary breakpoint 1, main () at main.c:22
22              main();
(gdb) list
17      int main(void)
18      {
19              /* local variables */
20
21              /* body program */
22              main();
23
24              return 0;
25      }
(gdb) n
Program received signal SIGSEGV, Segmentation fault.
main () at main.c:22
22              main();
(gdb) 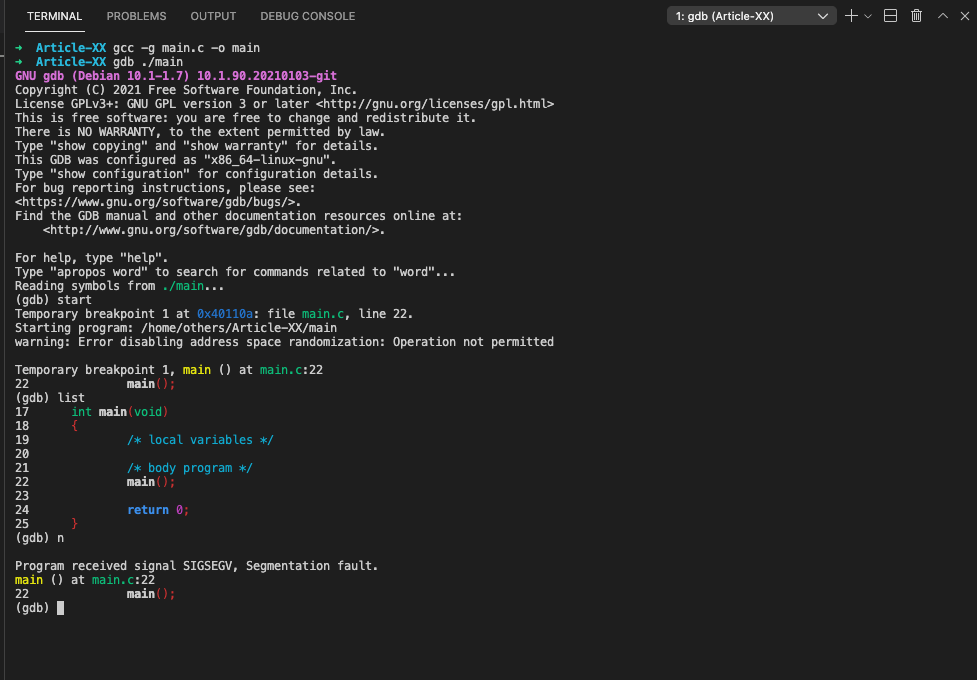
#2. How do you Fix Segmentation Faults?
Because segmentation faults are often associated with memory management issues or problematic pointer assignments, they can be fixed by making sure that the target application correctly handles these errors and does not attempt to read or write memory locations outside its own address space.
There are also certain procedures which you can follow in order to prevent and fix segmentation faults:
#a. How to Prevent Segmentation Faults?
Most segmentation faults occur due to memory access errors, so it’s important to make sure that pointers used by an application always reference valid data areas.
- Check the reference of null memory.
- Testing the code with Valgrind or Electric Fence
- Assert() before dereferencing a suspective pointer, mainly a pointer embedded in a struct that is maintained in a container in a list or an array.
- Always remember to initialize pointers properly.
- Protect shared resources against concurrent access in multithreading by using a mutex or a semaphore.
- Use of free() routine
#b. How to Fix Segmentation Faults?
There are some tools that you can use in order to fix the segmentation faults:
- Gdb and core dump file
- Gdb and backtrace.
- Debugfs and Dmesg for kernel debugging
Conclusion
A segmentation fault is generally caused by a programming bug that tries to access either non-existent or protected memory. It can also happen as a result of dividing an integer by zero (causing the program counter to be redirected to nowhere), accessing memory that is out of bounds at an address that does not contain valid data or code.
Finally, when enabled on some operating systems (and in some embedded programming environments), the processor may issue an exception if a memory address contains a non-mapped machine code instruction.
I hope this post has clarified what segmentation faults on the x86 architecture imply and how to avoid them. Do not forget to share the information on social networks if you believe it is useful for others. If you have any queries, please do not hesitate to leave a comment and subscribe to our newsletter. Best of luck with your coding and see you in the next article!
Understanding and solving errors are essential skills for any Linux administrator. The most common errors you will get are: “no such file or directory found” or “unable to access or permission denied”. If you are a Linux administrator, it is mandatory to know how to detect and solve segmentation faults. In this article, we will explain what segmentation fault is, what causes them, and how to detect or troubleshoot them. So let’s get started.
What Is a Segmentation Fault?
A segmentation fault is nothing but the error that occurs due to failed attempts to access Linux OS’s memory regions. These types of faults are detected by the kernel. Once detected, the process is immediately terminated, and a “segmentation violation signal” or “segmentation fault” is issued.
We can find most segmentation faults in lower-level languages like C (the most commonly used/ fundamental language in both LINUX and UNIX). It allows a great deal on memory allocation and usage. Hence, developers can have full control over the memory allocation.
What Causes a Segmentation Fault?
In the Linux or kernel operating system, the following are the conditions that cause a segmentation fault:
- Segmentation Violation Mapping Error (SEGV_MAPERR): This is the error that occurs when you want to access memory outside the application that requires an address space.
- Segmentation Violation Access Error (SEGV_ACCERR): This is the error that occurs when you want to access memory where the application does not have permission or write source codes on read-only memory space.
Sometimes we assume that these two conditions cause major problems, but that’s not always true. There might be chances of getting errors through referencing NULL values, freed pointers available for the reference memory areas, non-initialized parameters, and StackOverflow.
Examples That Generate Segmentation Faults in Linux
Here, we are going to explain a few code snippets that generate the segmentation default in Linux:
void main (void) {
   char *buffer;  /* Non initialized buffer */
   buffer[0] = 0; /* Trying to assign 0 to its first position will cause a segmentation fault */
}
We can now run and compile them on Linux kernel as follows:
$ gcc -o seg_fault -ggdb seg_fault.cOutput:
Segmentation fault (core dumped)In the above example, ulimit dumps the process memory on errors, and the compiling done with the help of GCC or -ggtb options, adds debug information on the resulting binary.
In addition, we can also enable get debug information and core dumping where the error occurred as shown in the below example:
$ gdb ./seg_fault /var/crash/core.seg_faultOutput:
... <snip> ...
Reading symbols from ./seg_fault...
[New LWP 6291]
Core was generated by `./seg_fault'.
Program terminated with signal SIGSEGV, Segmentation fault.
#0  0x000055ea4064c135 in main () at seg_fault.c:4
4 buffer[0] = 0;Note: However, if you don’t have to debug information, you can still identify the errors with the help of the name of the function, and values where we are getting errors.
How to Detect a Segmentation Fault
Till now, we have seen a few examples where we get errors. In this section, we will explain how to diagnose/detect the segmentation fault.
Using a debugger, you might detect segmentation faults. There are various kinds of debuggers available, but the most often used debuggers are GDB or -ggtb. GDB is a well-known GNU debugger that helps us view the backtrace of the core file, which is dumped by the program.
Whenever a segmentation fault occurs in the program, it usually dumps the memory content at the time of the core file crash process. Start your debugger, GDB, with the “gdb core” command. Then, use the “backtrace” command to check for the program crash.
If you are unable to detect the segmentation fault using the above solution, try to run your program under “debugger” control. Then, go through the source code, one code line or one code function at a time. To perform this task, all you need to do is compile your program codes without optimization, and use the “-g” flag to find out the errors.
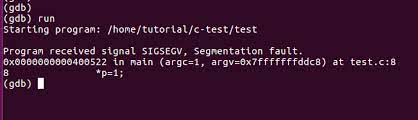
Let us explain the simple steps required to identify segFault inside GDB:
-
Make sure you have enabled the debugger mode (-g flag should also be a part of the GCC line). It looks like this:
gcc -g -o segfault segfault.c-
Then load the file into the gdb format:
-
For the sample code, use this navigation to identify the codes that cause SegFault:
-
Then, run your program: Starting program: /home/pi/segfault
program received signal SIGSEGV, Segmentation fault.The following image illustrates the above steps:
How to Prevent Segmentation Faults in Linux?
When you write a program using pointers, memory allocators, or references, make sure that all the memory accessories are within the boundary and compile with proper access restrictions.
The below are the important things which you should take care of them to avoid segmentation faults:
- Using gdb debugger to track the source of the problem while using dynamic memory location.
- Make sure that you have installed or configured the correct hardware or software components.
- Maintaining type consistency throughout the program code and the function parameters that call convention values will reduce the Segfault.
- Always make sure that all operating system dependencies are installed inside the jail.
- Stop using conditional statements in recursive functions.
- Turn on the core dumping support services (especially Apache) to prevent the segmentation fault in the Linux program.
These tips are very important as they improve code robustness and security services.
Final Take
If you are a Linux developer, you might have gone through the segmentation fault scenarios many times. In this post, we have tried to brief you about SegFault, given real-time examples, explained the causes for the SegFault, and discussed how to detect and prevent segmentation faults.
We hope this blog may help a few Linux communities, Linux administrators, and Linux experts worldwide who want to master the core concepts of the Linux kernel system.
Fault (technology)
Linux kernel
Segmentation fault
Memory (storage engine)
shell
operating system
Opinions expressed by DZone contributors are their own.
What does it mean?
See AU: What is a segmentation fault? post and also this post which have some examples how reproduce it, SO: What is segmentation fault?.
The simplest description I can come with (may be not the perfect):
The program tried to access a memory area out side its own section. Operating system blocks it.
Some cases: Reading value with uninitialized pointer, Going out of range in an array, Function call (when backward compatibility not maintained), …
However, it is not always easy find the cause with large programs or those which relay on other project lib’s. And most of the cases end up with a bug report, either for target program or one of its dependencies (either upstream project or downstream distribution package).
How can I resolve this issue?
-
Fire a bug report
If you didn’t make any custom configuration/setup and you all updates installed. fire a bug report, see How do I report a bug?
If open source supported by Ubuntu use
ubuntu-bug(apport-bug). For 3rd party closed source, check their help pages how to report bugs and collect related data. -
Take initiative to debug
If you you have even a little programming background, it is recommended that you try your best to resolve it yourself. There many bug reports out there inactive for years. At least, you may be able to collect enough debug data that help resolve the issue when reporting it.
That’s means that you are breaking the user abstraction level and opening the black box! (FLOSS actually has transparent box).
Some Useful Tools for Debugging
Some … I mean there are many other useful tools out there that you gonna find when you dig in more.
-
apport-buglogs / core dump / backtraceIf you don’t have an error message before segmentation fault. Run it with
--saveoption and look for back-trace log:apport-bug program-cmd --save bug-report_output.txt -
gdbbacktrace / debuging source codeIf it didn’t work, use
gdb:$ gdb program-cmd (gdb) run (gdb) backtraceIf you get any error message, check the web, launchpad and in upstream project bug tracker if there any similar cases.
For some advanced users or who are following a c/c++ learning path, they could download the corresponding
-dbgsymbols packages. Then you can usegdbto trace program flow through the source and get the exact function/instruction that raise the runtime error.For Ubuntu(Debian) based distributions, source code of a package can be downloaded using:
apt-get source <package-name> -
stracesystem call tracingAnother tool that may help is
strace, I like it. It’s really a powerful tool.It presents itself:
In the simplest case
straceruns the specified command until it exits. It intercepts and records the system calls which are called by a
process and the signals which are received by a process. The name of each system call, its arguments and its return value are printed on
standard error or to the file specified with the -o option.straceis a useful diagnostic, instructional, and debugging tool. System administrators, diagnosticians and trouble-shooters will find it
invaluable for solving problems with programs for which the source is not readily available since they do not need to be recompiled in
order to trace them. Students, hackers and the overly-curious will find that a great deal can be learned about a system and its system
calls by tracing even ordinary programs. And programmers will find that since system calls and signals are events that happen at the
user/kernel interface, a close examination of this boundary is very useful for bug isolation, sanity checking and attempting to capture
race conditions.Source:
man strace -
ltracedynamic library call tracingltraceis a program that simply runs the specified command until
it
exits. It intercepts and records the dynamic library calls which are
called by the executed process and the signals which are received by
that process. It can also intercept and print the system calls exe‐
cuted by the program.Its use is very similar to
strace(1).Source:
man ltrace
The core file is normally called core and is located in the current working directory of the process. However, there is a long list of reasons why a core file would not be generated, and it may be located somewhere else entirely, under a different name. See the core.5 man page for details:
DESCRIPTION
The default action of certain signals is to cause a process to
terminate and produce a core dump file, a disk file containing an
image of the process’s memory at the time of termination. This image
can be used in a debugger (e.g., gdb(1)) to inspect the state of the
program at the time that it terminated. A list of the signals which
cause a process to dump core can be found in signal(7).…
There are various circumstances in which a core dump file is not produced:
   *  The process does not have permission to write the core file.  (By
      default, the core file is called core or core.pid, where pid is
      the ID of the process that dumped core, and is created in the
      current working directory.  See below for details on naming.)
      Writing the core file will fail if the directory in which it is to
      be created is nonwritable, or if a file with the same name exists
      and is not writable or is not a regular file (e.g., it is a
      directory or a symbolic link).
   *  A (writable, regular) file with the same name as would be used for
      the core dump already exists, but there is more than one hard link
      to that file.
   *  The filesystem where the core dump file would be created is full;
      or has run out of inodes; or is mounted read-only; or the user has
      reached their quota for the filesystem.
   *  The directory in which the core dump file is to be created does
      not exist.
   *  The RLIMIT_CORE (core file size) or RLIMIT_FSIZE (file size)
      resource limits for the process are set to zero; see getrlimit(2)
      and the documentation of the shell's ulimit command (limit in
      csh(1)).
   *  The binary being executed by the process does not have read
      permission enabled.
   *  The process is executing a set-user-ID (set-group-ID) program that
      is owned by a user (group) other than the real user (group) ID of
      the process, or the process is executing a program that has file
      capabilities (see capabilities(7)).  (However, see the description
      of the prctl(2) PR_SET_DUMPABLE operation, and the description of
      the /proc/sys/fs/suid_dumpable file in proc(5).)
   *  (Since Linux 3.7) The kernel was configured without the
      CONFIG_COREDUMP option.
In addition, a core dump may exclude part of the address space of the
process if the madvise(2) MADV_DONTDUMP flag was employed.Naming of core dump files
By default, a core dump file is named core, but the
/proc/sys/kernel/core_pattern file (since Linux 2.6 and 2.4.21) can
be set to define a template that is used to name core dump files.
The template can contain % specifiers which are substituted by the
following values when a core file is created:%% a single % character %c core file size soft resource limit of crashing process (since Linux 2.6.24) %d dump mode—same as value returned by prctl(2) PR_GET_DUMPABLE (since Linux 3.7) %e executable filename (without path prefix) %E pathname of executable, with slashes ('/') replaced by exclamation marks ('!') (since Linux 3.0). %g (numeric) real GID of dumped process %h hostname (same as nodename returned by uname(2)) %i TID of thread that triggered core dump, as seen in the PID namespace in which the thread resides (since Linux 3.18) %I TID of thread that triggered core dump, as seen in the initial PID namespace (since Linux 3.18) %p PID of dumped process, as seen in the PID namespace in which the process resides %P PID of dumped process, as seen in the initial PID namespace (since Linux 3.12) %s number of signal causing dump %t time of dump, expressed as seconds since the Epoch, 1970-01-01 00:00:00 +0000 (UTC) %u (numeric) real UID of dumped process