

Краткая инструкция по чтению и разбору логов мобильных устройств на Android и iOS, а также необходимые инструменты для Windows и MacOS.
Статья подготовлена red_mad_robot и «Альфа-Банком» на основе доклада Senior QA red_mad_robot Ольги Никитиной «Инструменты для снятия логов с Android / iOS устройств. Чтение и разбор» на митапе «QАчественное общение» при поддержке red_mad_robot.
Уровни логирования и что они означают
Для начала разберёмся с логами. Это текстовые файлы, в которых записываются все действия пользователя. Например, какие кнопки он нажимает в приложении и как на это оно реагирует в ответ.
Записи в логах формируются в хронологическом порядке. Самая свежая — внизу.
Есть два вида логов:
-
Crash logs — файл, в котором хранятся записи только об ошибках экстренного завершения программы — по-простому, когда приложение крашнулось.
-
Logs — простые логи, или журнал событий. Это файл, в котором хранятся системные записи и ответы устройства на действие пользователя.
Логи на мобильных устройствах бывают нескольких уровней:
-
ERROR,
-
WARN,
-
INFO,
-
DEBUG,
-
VERBOSE.
Они представлены по уровню важности — от самого высокого к самому низкому, — и каждый следующий уровень включает в себя предыдущий. Например, VERBOSE содержит в себе логи всех остальных.
Примечание: уровни более применимы к логам на Android, потому что именно там такое разделение встречается чаще.
Рассмотрим подробнее каждый уровень.
Error (ERROR)
На этом уровне информируются ошибки работы системы.
Записи этого уровня требуют быстрого вмешательства разработчика — на такие ошибки нужно реагировать максимально быстро.
Как пример, такая запись в логе:
“ SpannableStringBuilder: SPAN_EXCLUSIVE_EXCLUSIVE spans cannot have a zero length ”
Это ошибка, в которой говорится, что строковый элемент span не может быть пустым.
Или вот:
“ [ZeroHung]zrhung_get_config: Get config failed for wp[0x0008] ] ”
Эта системная ошибка сообщает, что происходит утечка памяти при взаимодействии с каким-то элементом или приложением.
Warning (WARN)
На этом уровне отображаются записи, сообщающие о каком-то неожиданном поведении, требующем внимания, или о ситуации, которая незнакома системе.
Например, сообщение ниже — запись из тестового приложения:
“ [OMX.hisi.video.decoder.avc] setting nBufferCountActual to 16 failed: -2147483648 “
Мы пытаемся декодировать запись в какой-то формат, но его нет. Ошибка сообщает о неуспешной попытке настройки видеоплеера в нужном формате.
Ещё пример:
“ BroadcastQueue: Permission Denial: broadcasting Intent ”
Эта системная ошибка говорит о сбое в работе одного из виджетов на устройстве.
Info (INFO)
На этот уровень приходят записи информационного характера, например о работе системы.
Допустим, такое сообщение об уровне заряда батареи на устройстве:
“ APwBatteryMonitor: screen off start battery: 100 ”
А это сообщение говорит о том, что экран устройства был выключен:
“ HwBatteryService: intent = Intent { act=android.intent.action.SCREEN_OFF flg=0x58200010 } ”
Ещё в логи этого уровня входят запросы от клиента на сервер: хедеры, тело запросов, которые отправляет клиент, и ответы сервера.
“ okhttp.OkHttpClient: <— 200 https://domainname/api/v1/smth/deals (1691ms)
okhttp.OkHttpClient: server: nginx/1.15.9
okhttp.OkHttpClient: date: Thu, 23 Sep 2021 19:41:17 GMT
okhttp.OkHttpClient: content-type: application/json
okhttp.OkHttpClient: vary: Accept-Encoding
okhttp.OkHttpClient: strict-transport-security: max-age=15724800; includeSubDomains
okhttp.OkHttpClient: {«key»:{«key»:value,»name»:»»},»key»:value,»key»:value}
okhttp.OkHttpClient: <— END HTTP ”
Такие записи могут помочь вам в понимании какого-то бага или в разборе задачи при условии, что вы не можете перехватить трафик или не знаете, какие запросы отправляются на бэкенд.
Debug (DEBUG)
Это уровень сообщений, в которых передаётся информация о процессах отладки или шагах работы крупных процессов.
Например, в записи ниже сказано, что пользователь нажимал на кнопку уменьшения или увеличения громкости:
“ MediaSessionService: dispatchVolumeKeyEvent ”
Сначала мы видим запись о самом факте нажатия на кнопку, далее оно расшифровывается подробнее:
{ action=ACTION_DOWN, keyCode=KEYCODE_VOLUME_UP }
Ещё пример: если ваше приложение использует сокет-сессию, то на уровне DEBUG мы можем увидеть, когда сессия начинается и заканчивается:
“ b$b: WebSocket connected ”
Verbose (VERBOSE)
Сообщения такого уровня уточняют или раскрывают действия.
Например, у нас есть служба управления окнами на экране приложения. И на уровне Verbose мы можем увидеть подробности её работы.
Открытие окна:
WindowManager: addWindow
Закрытие окна:
WindowManager: Removing Window
На этом уровне мы можем посмотреть системные подробности наших действий. Например, при включении геолокации в записи отобразится текущая геолокация.
GnssLocationProvider: reportLocation Location […]
А меняя звук на устройстве, мы увидим, как растёт или падает значение:
AudioManager: getStreamVolume streamType: 3 volume: 10
Каждое нажатие, то есть изменение звука, будет отражаться новым сообщением.
Verbose — уровень самого низкого приоритета. Выбирая такой уровень отображения логов, мы будем видеть записи и со всех предыдущих уровней.
Примечание: разработчики приложения самостоятельно покрывают действия логами, определяют уровни, а также какие сообщения какому из них соответствуют.
Инструменты для снятия логов: Android
Расскажем о трёх способах.
Первый — Logcat в составе Android Studio, самый известный и широко используемый.
Для снятия логов нам необходимо перевести устройство в режим разработчика/отладки. Для этого нужно:
-
найти в настройках номер нашего билда или ОС (в зависимости от устройства),
-
около десяти раз нажать на эту информацию,
-
при появлении сообщения о том, не хотим ли мы перевести устройство в режим разработчика, нажать «Ок».
Примечание: алгоритм может отличаться в зависимости от производителя устройства, потому что у многих из них свои надстройки на ОС Android.
Дальше подключаем устройство по USB к ПК и устанавливаем Android Studio.
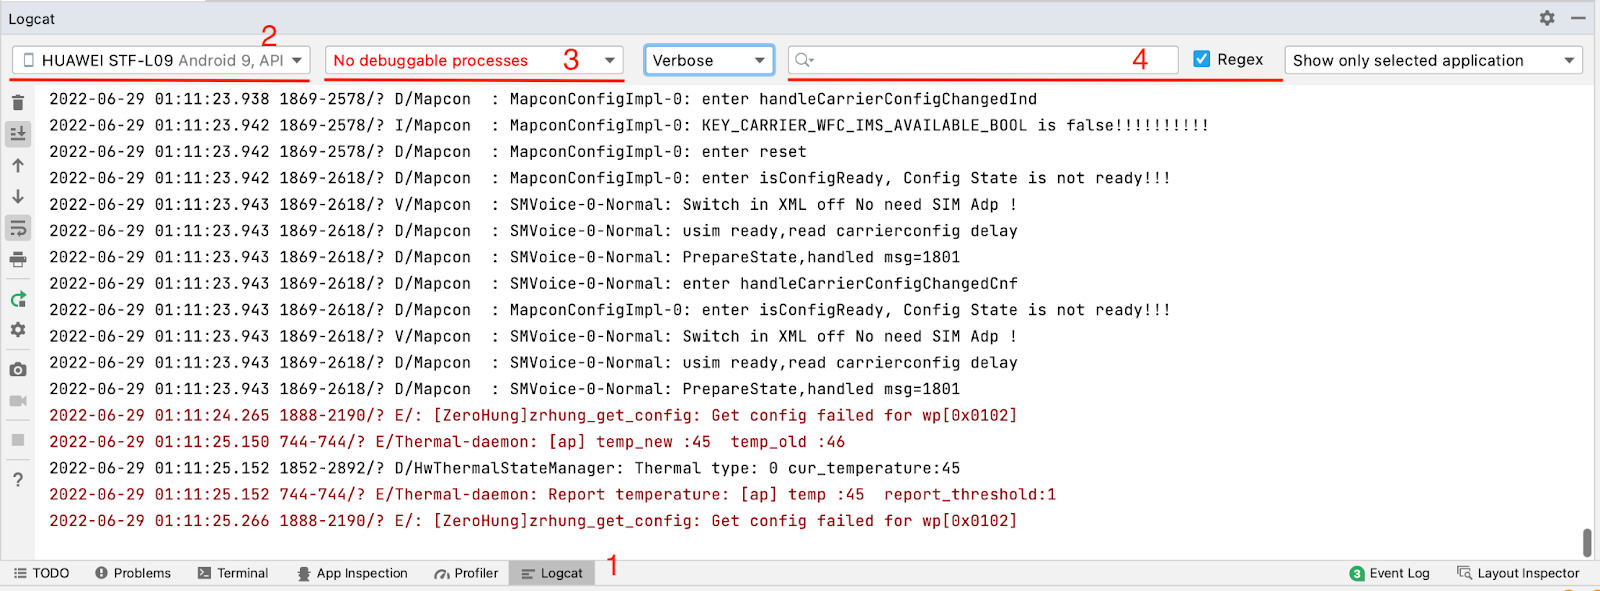
Следующие шаги на скрине:
-
Выбираем вкладку Logcat (переходим к сообщениям в реальном времени).
-
В окошке выбираем телефон, с которого снимаем логи.
-
На этой вкладке выбираем логи определённого приложения. Если нужно снять вообще все логи со всех приложений и системы, эту вкладку стоит не трогать. Рядом с ней можно выбрать уровень логирования (вкладка Verbose на скрине).
-
В поле поиска, где мы можем фильтровать выдачу, разрешено писать что угодно — от названия пакета до частей вроде fatal.
На скрине видно логи с подключенного устройства.

Второй способ — выгрузка логов с самого устройства. Кроме режима разработчика нам нужно подключить устройство к ПК через USB и установить ADB — Android Debug Bridge.
Открываем терминал и пишем две команды.
Первая — adb devices — показывает подключённые устройства, которые видит ADB. В терминале выглядит так:

Вводим вторую команду — adb -s название устройства logcat, — которая запускает утилиту Logcat для конкретного устройства. В терминале в реальном времени будут поступать логи.

Как их читать?
-
В первом столбце — дата и время поступления записи.
-
Во втором — обозначения уровней логирования. Например, D — это Debug.
-
В третьем показываются названия инструмента, утилиты, пакета, от которых поступает сообщение, а также расшифровка того, что вообще происходит.
Третий инструмент — SDK Platform Tools. Процесс его установки практически аналогичен предыдущим двум:
-
переводим телефон в режим разработчика,
-
подключаем к ПК по USB,
-
скачиваем на ПК папку SDK PT (под свою ОС),
-
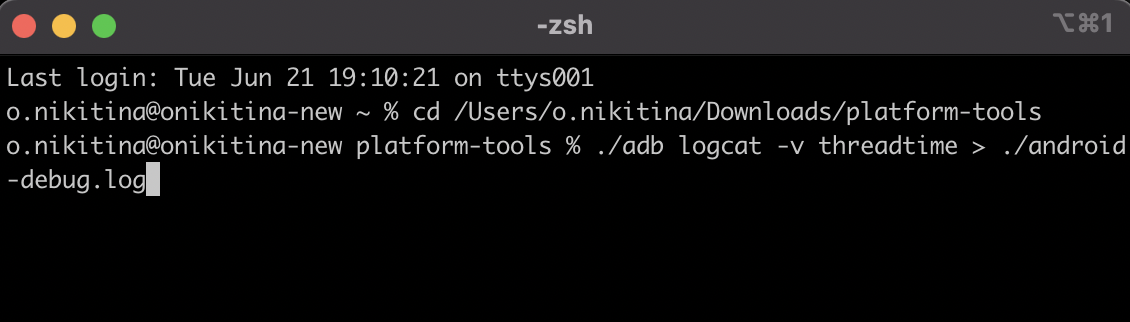
открываем папку SDK PT в терминале.
Теперь пишем команду ./adb logcat –v threadtime > ./android-debug.log.
В терминале это выглядит так:
Прерываем выполнение команды (например, на Mac это Control+C). Лог добавляется в папку.

Открываем:

Очень похоже на предыдущий терминал, но файл обновляется, пока в терминале действует команда.
Инструменты снятия логов: iOS
В первую очередь нас интересует xCode — интегрированная среда разработки (IDE), в которую встроен нужный нам инструмент Simulator.
Как использовать инструмент:
-
Устанавливаем xCode.
-
В системной строке нажимаем xCode → Open Developer Tools → Simulator.
-
Устанавливаем приложение.
-
В самом симуляторе выбираем Debug → Open System Log.
Мы будем видеть логи в реальном времени:

Подобное оформление логов мы уже где-то видели, но построение информации в выдаче немного отличается. Есть дата и время (1) и данные (2) о том, с какого устройства снята информация: имя компьютера, элемент системы, с которого пришло сообщение, и его расшифровка.
Но первый способ работает только с симуляторами. Если необходимо снимать логи с реального устройства, в этом может помочь раздел Devices and Simulators.
Записи можно отфильтровать по конкретному процессу (вашему приложению):
-
Устанавливаем xCode.
-
Подключаем устройство к ПК по USB.
-
Открываем xCode → Windows → Devices and Simulators.
Дальше нажимаем у устройства Open Console и видим панель с названием устройства, информацией о модели и ОС:

Логи поступают в реальном времени, но их удобно отслеживать:

У нас есть три столбца:
-
«Время» — время поступления сообщения.
-
«Процесс» — с какой части системы/приложения пришло сообщение.
-
«Сообщение» — описание события, сервисная информация.
В инструменте есть поиск для фильтрации выдачи. Ещё есть полезная кнопка «Приостановить» — она останавливает поток логов.
А вот утилита iMazing поможет снимать iOS-логи для тех, у кого установлен Windows. Приложение платное, но часть функциональности доступна бесплатно. Например, за снятие логов устройства платить не нужно.

В меню выбираем «Показать консоль устройства». В открывшемся окне приходят записи логов в реальном времени со всего устройства.

Ещё одно важное достоинство iMazing — возможность сохранять логи (разумеется, по кнопке «Сохранить»).
Статья подготовлена red_mad_robot и «Альфа-Банком» на основе доклада Senior QA red_mad_robot Ольги Никитиной «Инструменты для снятия логов с Android / iOS устройств. Чтение и разбор» на митапе «QАчественное общение» при поддержке red_mad_robot.
Yoodley is reader-supported. When you buy through links on our site, we may earn an affiliate commission.
If you are looking to learn how to obtain and examine android logs, this is just the post for you. Log analysis is important to recognize bugs and obstructions in an application-in-making which is provided by a set of logs. Let’s start with the basics first, however.
Different types of Logs and what they contain
Android has a centralized system of all logs, and these logs are available in different categories, which allows the users and the application programmers to look for a particular filter for the log statement.
The log analysis helps the developers to find the fault in a log and develop the application from time to time. Different types of logs available in Android are Application log, System log, Event log, Radio log.
What Each Log Type Contains:
Application log:
This mainly contains log messages from all the different types of applications running on an android device.
The android.util.Log class method is used to write messages of different priorities in the log.
System log:
Messages or logs in this category are set with different priorities from the android logs—the Android.util.Slog class is used to write messages of the system log.
Event log:
It consists of binary tag codes that are followed by binary parameters.
The event log messages are created by Android.util.EventLog class which help in creating binary-formatted log messages. These message tags are stored at: /system/etc/event-log-tags.
Radio log:
It has all the radio and phone-related information, like network info and signal strength.
In most android devices, root access is required for viewing android logs and also to examine them. These logs are located in the internal storage, and in order to access the internal storage sources, root access is required.
Android devices with older versions or below 4.0, can use the SDK or ADB logcat or any other log viewer available on Google play that directly shows logs on your phone.
Android devices with version 4.1 or above require SDK and ADB logcat to view the full system logs, but they require rooted devices to work, or they can work by issuing a manual command via ADB.
File Locations where you can view Android Logs
Since there is a variety of logs available on your Android device, they are located at different locations, and it is at times difficult to find a particular log through several directories. Here are some common file locations where you can find some important logs:
- /data/anr: Here, you will find Dalvik’s written stack traces.
- /data/dontpanic: It has standard crash logs and traces.
- data/panic/panic_daemon.config: It points to another configured location.
- /data/tombstones: It has several tombstone_nn files, which are also referred to as “core dumps” on Linux systems.
How to obtain Android logs on:
Windows:
These are steps that you need to follow in order to obtain Android logs on your Windows PC.
- Install the latest Android SDK on your Windows PC.
- Then install the Android Platform Tools.
- Connect your android device to your Windows PC with a USB cable.
- Open a new command prompt session, change the working directory to the path where Android SDK is installed (cd [path where Android SDK resides]/platform-tools).
- First, run the following command adb.exe kill-server
- Next, run the command to list the devices connected to your PC. Note down the device ID of your device.
- Run adb.exe logcat -v threadtime [device id] > C:android-debug.log
Enter the device id obtained in the previous step in place of [device id].
- Perform any actions on your Android device.
- Press Ctrl + C on the command prompt window to stop the ADB process.
- The debug data can be viewed from the c:android-debug.log file.
Mac:
On a Mac device, follow the steps given below;
- Download and install Android SDK. Once the installation completes, Android SDK will launch automatically. Select and Install Android Platform Tools.
- Connect your Android device to your Mac device via USB cable.
- Open a new Terminal, change the working directory to the path where Android SDK is installed (cd [path where Android SDK resides]/platform-tools).
- First, run the following command
./adb kill-server
- Next, run the command to list the devices connected to your PC. Note down the device ID of your device.
./adb devices
- Run,
./adb logcat -v threadtime [device ID] > /tmp/android-debug.log
Enter the device id obtained in the previous step in place of [device id].
- Perform any actions on your Android device or reproduce any issue you encountered.
- To stop the ADB process, press Ctrl + C on the Terminal window.
- The debug data can be viewed from the android-debug.log file.
How to view Android Logs without rooting your device?
There are many users who don’t want to root their device as it might lose the warranty of the device provided by the manufacturers. It is also not a completely safe and easy process, so for those not wanting to root their phone, here are some processes of viewing Android logs that do not require rooting:
These methods will work on almost every android version. The required prerequisites are:
- Linux, Windows or Mac
- USB cable for your device
- Android Device
Instructions
- Install required device drivers for using ADB.
- Download ADB that is executable on your OS. Although it is a part of Android SDK, you can also get an ADB executable individually.
- Now connect your android device.
- Enable USB debugging on your android device.
- Open a command prompt (Windows) or terminal (Linux / mac). (On Windows: windows + r > enter “cmd” (without quotes) > click enter | On Mac: Type Terminal into Spotlight and open it.)
- CD to the directory where the ADB executable is located. On Windows: Go to the directory where you downloaded the ADB executable, Shift+Right Click and select “Open Console” (or similar) | On Linux / Mac: Right Click in the directory and select “Open Terminal here” (or simply CD into the directory)
- Type in your cmd/terminal: ADB devices to verify your device is properly connected.
- If your device is properly selected, type in ADB logcat to show the mighty and magic logcat aka stacktrace.
FAQs
Q. How to Fix “Android studio logcat nothing to show” in Android Studio?
A. If the Android Studio shows nothing in the logcat, it may happen because of the small Logger Buffer Size, or there might be some issue with Android Studio itself. In order to fix this issue, check if you are using the latest and updated version of Android Studio. Reboot your android device and try again. If the problem still persists following the given solutions;
Android Debug Bridge (ADB) use libusb backend
- Android Studio > Preferences > Debugger > Android Debug Bridge (ADB) enable “Use libusb backend”
- Restart android studio with Invalidate cache.
Increasing Logger Buffer Sizes
- On your android device, go to Settings –> Developer Options –> search for Logger buffer Sizes ( change it to 1M or Bigger size ), and then your android studio IDE will show data in Logcat.
Q. How to capture Android Logs?
A. Problems like unusual bugs in the Android Logs showing error, debug messages and other bugs isn’t something new. Whenever an app is developed, built aur updated, it may have bugs that need to be fixed when found.
Here are steps to create a logcat file which you can attach to a bug report,
For a computer
- You must have ADB installed on your device; if not, then you must install it before moving further.
- Open Command Prompt (Windows) or Terminal (Linux/macOS).
- Connect your device via cable or over WiFi
- Type ADB logcat -d > logcat.txt. This will save the log to logcat.txt.
- Additionally, the radio buffer can be viewed or stored with logcat. If needed or requested, type ADB logcat -db radio > radio.txt to save it to radio.txt.
On your device:
To use this method, your device must be rooted, and this process is only supported up through LineageOS 16.0; users with 17.1 or above version need to follow the computer process.
- Open the Terminal app (you can enable the built-in terminal app in Developer options).
- Type su and confirm root access – you may have to turn on root access for apps in Developer options.
- Type logcat -d -f /sdcard/logcat.txt. This will save the log to /sdcard/logcat.txt.
- Additionally, the radio buffer can be viewed or stored with logcat. If needed or requested, type logcat -db radio -f /sdcard/radio.txt to save it to /sdcard/radio.txt.
Q. How do I capture Crash Logs on Android?
A. Capturing crash logs or bugs of an android to debug and fix the errors is quite easy.
Follow the steps given below to capture logs on Android;
- Connect your android device with a USB cable to your PC with ADB installed to it.
- Open CLI (Terminal on a Mac) (Start –> Run –> CMD on Windows).
- Navigate using the terminal to the Android SDK directory (for example, C:Program FilesAndroidandroid-sdkplatform-tools).
- Type ADB logcat.
- Check for the logs that you want to create, examine and fix.
- If you want to save the output to file, run: ADB logcat >/$*some-folder*/android-debug.log
Q. Should I delete log files on my Android device?
A. A log has a definite limit up to which it can grow, and after that, the older logs are pruned to keep the log from growing further. And in some android devices, the logs are kept only in memory, and sometimes the logs are stored on a disk. You can delete the logs or clear them, but immediately a new log message will appear the moment you execute the command.
Q. How to view android logs on a Samsung device?
A. Getting the android logs on a Samsung device is easier and fast with the secret code *#9900#. To get to the android logs in a Samsung device following the given steps;
- Open the Phone app on your device and type: *#9900#
- Depending on how many detailed logs you would like to get, change Debug Level and Silent log options (by default Debug Level is Disabled/LOW and Silent Log is turned Off)
- Click on Run dumpstate/logcat/modem log
- Click Copy to sdcard(include CP Ramdump). It is an important step because, by default, collected logs will be stored in the /data/log directory, which is under root permissions, so you can’t access it without root permissions
- Your logs will be stored in the /log directory on your DEVICE STORAGE, from where you can access them at any time.
Read More
- Where do Android Apps Store Data?
- What is /storage/emulated/0/? How to Access it?
- Which version of GApps to install for Lineage OS?
I would like to pull the log file from a device to my PC. How can I do that?
asked May 21, 2010 at 13:04
![]()
Pentium10Pentium10
204k122 gold badges422 silver badges500 bronze badges
I hope this code will help someone. It took me 2 days to figure out how to log from device, and then filter it:
public File extractLogToFileAndWeb(){
        //set a file
        Date datum = new Date();
        SimpleDateFormat df = new SimpleDateFormat("yyyy-MM-dd", Locale.ITALY);
        String fullName = df.format(datum)+"appLog.log";
        File file = new File (Environment.getExternalStorageDirectory(), fullName);

        //clears a file
        if(file.exists()){
            file.delete();
        }


        //write log to file
        int pid = android.os.Process.myPid();
        try {
            String command = String.format("logcat -d -v threadtime *:*");
            Process process = Runtime.getRuntime().exec(command);

            BufferedReader reader = new BufferedReader(new InputStreamReader(process.getInputStream()));
            StringBuilder result = new StringBuilder();
            String currentLine = null;

            while ((currentLine = reader.readLine()) != null) {
                   if (currentLine != null && currentLine.contains(String.valueOf(pid))) {
                       result.append(currentLine);
                       result.append("n");
                    }
            }

            FileWriter out = new FileWriter(file);
            out.write(result.toString());
            out.close();

            //Runtime.getRuntime().exec("logcat -d -v time -f "+file.getAbsolutePath());
        } catch (IOException e) {
            Toast.makeText(getApplicationContext(), e.toString(), Toast.LENGTH_SHORT).show();
        }


        //clear the log
        try {
            Runtime.getRuntime().exec("logcat -c");
        } catch (IOException e) {
            Toast.makeText(getApplicationContext(), e.toString(), Toast.LENGTH_SHORT).show();
        }

        return file;
    }
as pointed by @mehdok
add the permission to the manifest for reading logs
<uses-permission android:name="android.permission.READ_LOGS" />
![]()
Shubhank
21.7k8 gold badges65 silver badges83 bronze badges
answered Mar 4, 2014 at 14:10
![]()
user1354692user1354692
3523 silver badges7 bronze badges
1
I would use something of this sort :
$adb logcat -d > logcat.txt
The -d option dumps the entire circular buffer into the text file and if you are looking for a particular action/intent try
$adb logcat -d | grep 'com.whatever.you.are.looking.for' -B 100 -A 100 > shorterlog.txt
Hope this helps 
answered Sep 30, 2012 at 3:18
![]()
RohitRohit
3113 silver badges2 bronze badges
For those not interested in USB debugging or using adb there is an easier solution. In Android 6 (Not sure about prior version) there is an option under developer tools: Take Bug Report
Clicking this option will prepare a bug report and prompt you to save it to drive or have it sent in email.
I found this to be the easiest way to get logs. I don’t like to turn on USB debugging.
answered May 26, 2016 at 12:28
![]()
dreamwagondreamwagon
1,1991 gold badge14 silver badges17 bronze badges
2
EDIT:
The internal log is a circular buffer in memory. There are actually a few such circular buffers for each of: radio, events, main. The default is main.
To obtain a copy of a buffer, one technique involves executing a command on the device and obtaining the output as a string variable.
SendLog is an open source App which does just this: http://www.l6n.org/android/sendlog.shtml
The key is to run logcat on the device in the embedded OS. It’s not as hard as it sounds, just check out the open source app in the link.
answered May 21, 2010 at 13:28
![]()
Brad HeinBrad Hein
11k12 gold badges50 silver badges74 bronze badges
4
Often I get the error «logcat read: Invalid argument«. I had to clear the log, before reading from the log.
I do like this:
prompt> cd ~/Desktop
prompt> adb logcat -c
prompt> adb logcat | tee log.txt
answered Aug 24, 2011 at 9:37
![]()
neoneyeneoneye
50k24 gold badges165 silver badges151 bronze badges
1
I know it’s an old question, but I believe still valid even in 2018.
There is an option to Take a bug report hidden in Developer options in every android device.
NOTE: This would dump whole system log
How to enable developer options? see: https://developer.android.com/studio/debug/dev-options
What works for me:
- Restart your device (in order to create minimum garbage logs for developer to analyze)
- Reproduce your bug
- Go to Settings -> Developer options -> Take a bug report
- Wait for Android system to collect the logs (watch the progressbar in notification)
- Once it completes, tap the notification to share it (you can use gmail or whetever else)
how to read this?
open bugreport-1960-01-01-hh-mm-ss.txt
you probably want to look for something like this:
------ SYSTEM LOG (logcat -v threadtime -v printable -d *:v) ------
--------- beginning of crash
06-13 14:37:36.542 19294 19294 E AndroidRuntime: FATAL EXCEPTION: main
or:
------ SYSTEM LOG (logcat -v threadtime -v printable -d *:v) ------
--------- beginning of main
answered Jun 21, 2018 at 9:19
![]()
Piotr ZPiotr Z
86411 silver badges11 bronze badges
A simple way is to make your own log collector methods or even just an existing log collector app from the market.
For my apps I made a report functionality which sends the logs to my email (or even to another place — once you get the log you can do whether you want with it).
Here is a simple example about how to get the log file from a device:
- http://code.google.com/p/android-log-collector/
![]()
answered May 21, 2010 at 14:02
![]()
MossMoss
5,9921 gold badge35 silver badges40 bronze badges
Simple just run the following command to get the output to your terminal:
adb shell logcat
answered Apr 27, 2016 at 23:57
![]()
Weston GangerWeston Ganger
6,2944 gold badges41 silver badges39 bronze badges
Two steps:
- Generate the log
- Load Gmail to send the log
.
-
Generate the log
File generateLog() { File logFolder = new File(Environment.getExternalStorageDirectory(), "MyFolder"); if (!logFolder.exists()) { logFolder.mkdir(); } String filename = "myapp_log_" + new Date().getTime() + ".log"; File logFile = new File(logFolder, filename); try { String[] cmd = new String[] { "logcat", "-f", logFile.getAbsolutePath(), "-v", "time", "ActivityManager:W", "myapp:D" }; Runtime.getRuntime().exec(cmd); Toaster.shortDebug("Log generated to: " + filename); return logFile; } catch (IOException ioEx) { ioEx.printStackTrace(); } return null; } -
Load Gmail to send the log
File logFile = generateLog();
Intent intent = new Intent(Intent.ACTION_SEND);
intent.setFlags(Intent.FLAG_ACTIVITY_NEW_TASK);
intent.putExtra(Intent.EXTRA_STREAM, Uri.fromFile(logFile));
intent.setType("multipart/");
startActivity(intent);
References for #1
- https://stackoverflow.com/a/34883741/2162226
- https://stackoverflow.com/a/3359857/2162226
~~
For #2 — there are many different answers out there for how to load the log file to view and send. Finally, the solution here actually worked to both:
- load Gmail as an option
- attaches the file successfully
Big thanks to https://stackoverflow.com/a/22367055/2162226 for the correctly working answer
![]()
answered Dec 14, 2016 at 19:57
![]()
Gene BoGene Bo
11.1k8 gold badges89 silver badges135 bronze badges
Thanks to user1354692 I could made it more easy, with only one line! the one he has commented:
try {
    File file = new File(Environment.getExternalStorageDirectory(), String.valueOf(System.currentTimeMillis()));
    Runtime.getRuntime().exec("logcat -d -v time -f " + file.getAbsolutePath());}catch (IOException e){}
answered Mar 7, 2014 at 13:56
![]()
jfcogatojfcogato
3,3193 gold badges19 silver badges19 bronze badges
1
I have created a small library (.aar) to retrieve the logs by email. You can use it with Gmail accounts. It is pretty simple but works. You can get a copy from here
The site is in Spanish, but there is a PDF with an english version of the product description.
I hope it can help.
answered Jul 28, 2015 at 8:58
![]()
lm2alm2a
8251 gold badge10 silver badges19 bronze badges
0
First make sure adb command is executable by setting PATH to android sdk platform-tools:
export PATH=/Users/espireinfolabs/Desktop/soft/android-sdk-mac_x86/platform-tools:$PATH
then run:
adb shell logcat > log.txt
OR first move to adb platform-tools:
cd /Users/user/Android/Tools/android-sdk-macosx/platform-tools
then run
./adb shell logcat > log.txt
answered May 9, 2015 at 15:46
![]()
Aqib MumtazAqib Mumtaz
4,9361 gold badge36 silver badges33 bronze badges
I would use something like:
$ adb logcat --pid=$(adb shell pidof com.example.yourpackage)
which you can then redirect to a file
$ adb logcat --pid=$(adb shell pidof com.example.yourpackage) > log.txt
or if you also want to see it at stdout as well:
$ adb logcat --pid=$(adb shell pidof com.example.yourpackage) | tee log.txt
answered Feb 21 at 11:15
![]()
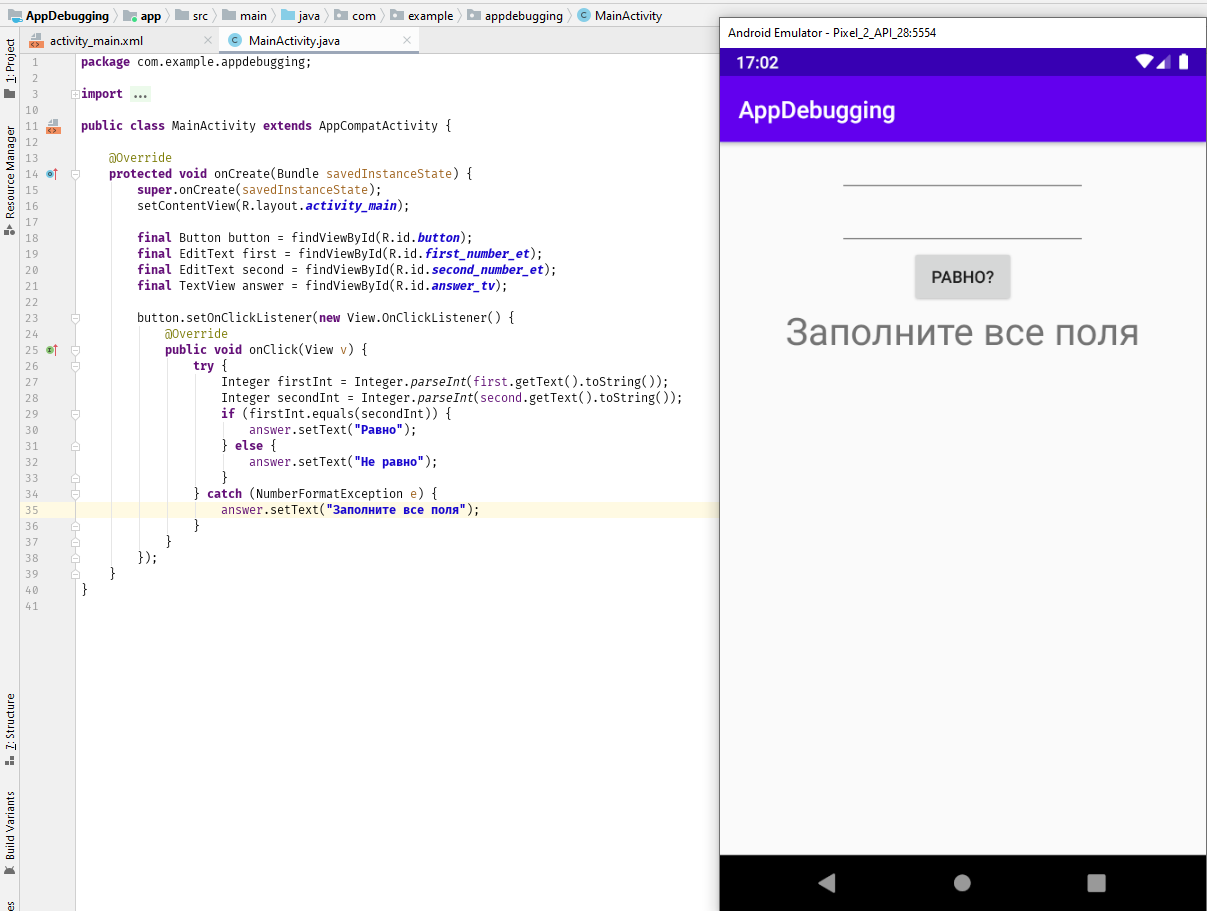
Приготовьте отладчик! Пишем приложение с ошибками, затем учимся их находить и дебажить
https://gbcdn.mrgcdn.ru/uploads/post/2735/og_image/ce05da5c8c8f97a3bf7713b7cbaf3802.png

Иногда в приложении встречаются ошибки, которые нельзя увидеть даже после запуска. Например, код компилируется, проект запускается, но результат далёк от желаемого: приложение падает или вдруг появляется какая-то ошибка (баг). В таких случаях приходится «запасаться логами», «брать в руки отладчик» и искать ошибки.
Часто процесс поиска и исправления бага состоит из трёх шагов:
- Воспроизведение ошибки — вы понимаете, какие действия нужно сделать в приложении, чтобы повторить ошибку.
- Поиск места ошибки — определяете класс и метод, в котором ошибка происходит.
- Исправление ошибки.
Если приложение не падает и чтение логов ничего не даёт, то найти точное место ошибки в коде помогает дебаггер (отладчик) — инструмент среды разработки.
Чтобы посмотреть на логи и воспользоваться дебаггером, давайте напишем простое тестовое (и заведомо неправильное) приложение, которое даст нам все возможности для поиска ошибок.
Это будет приложение, которое сравнивает два числа. Если числа равны, то будет выводиться результат «Равно», и наоборот. Начнём с простых шагов:
- Открываем Android Studio.
- Создаём проект с шаблоном Empty Activity.
- Выбираем язык Java, так как его, как правило, знают больше людей, чем Kotlin.
Нам автоматически откроются две вкладки: activity_main.xml и MainActivity.java. Сначала нарисуем макет: просто замените всё, что есть в activity_main.xml, на код ниже:
<?xml version="1.0" encoding="utf-8"?>
<androidx.constraintlayout.widget.ConstraintLayout xmlns:android="http://schemas.android.com/apk/res/android"
  xmlns:app="http://schemas.android.com/apk/res-auto"
  xmlns:tools="http://schemas.android.com/tools"
  android:layout_width="match_parent"
  android:layout_height="match_parent"
  tools:context=".MainActivity">

  <EditText
     android:id="@+id/first_number_et"
     android:layout_width="wrap_content"
     android:layout_height="wrap_content"
     android:ems="10"
     android:gravity="center"
     app:layout_constraintLeft_toLeftOf="parent"
     app:layout_constraintRight_toRightOf="parent"
     app:layout_constraintTop_toTopOf="parent" />

  <EditText
     android:id="@+id/second_number_et"
     android:layout_width="wrap_content"
     android:layout_height="wrap_content"
     android:ems="10"
     android:gravity="center"
     app:layout_constraintLeft_toLeftOf="parent"
     app:layout_constraintRight_toRightOf="parent"
     app:layout_constraintTop_toBottomOf="@+id/first_number_et" />

  <Button
     android:id="@+id/button"
     android:layout_width="wrap_content"
     android:layout_height="wrap_content"
     android:text="Равно?"
     app:layout_constraintLeft_toLeftOf="parent"
     app:layout_constraintRight_toRightOf="parent"
     app:layout_constraintTop_toBottomOf="@+id/second_number_et" />

  <TextView
     android:id="@+id/answer_tv"
     android:layout_width="wrap_content"
     android:layout_height="wrap_content"
     android:text=""
     android:textSize="32sp"
     app:layout_constraintLeft_toLeftOf="parent"
     app:layout_constraintRight_toRightOf="parent"
     app:layout_constraintTop_toBottomOf="@+id/button" />
</androidx.constraintlayout.widget.ConstraintLayout>
Можете запустить проект и посмотреть, что получилось:
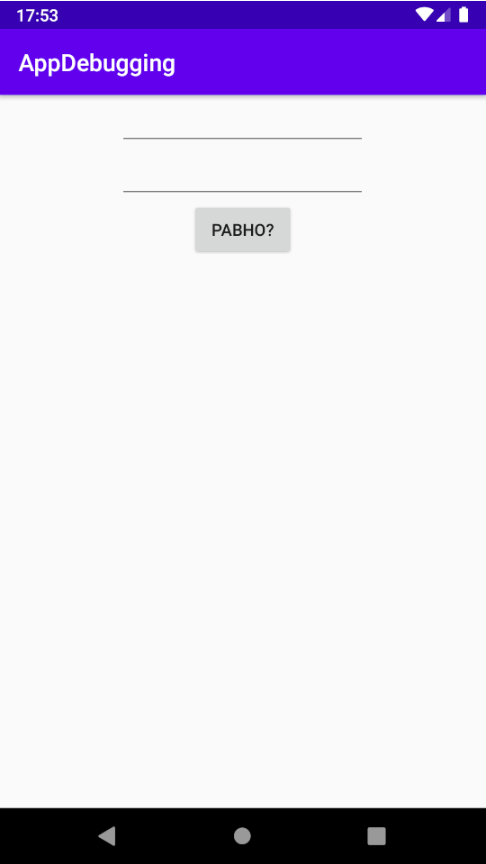
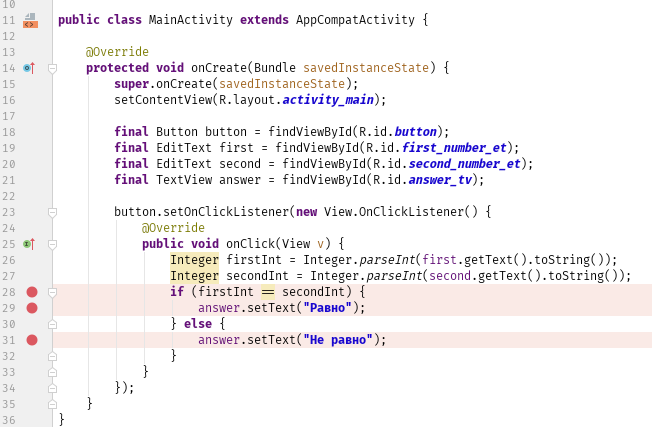
Теперь оживим наше приложение. Скопируйте в MainActivity этот код:
public class MainActivity extends AppCompatActivity {

  @Override
  protected void onCreate(Bundle savedInstanceState) {
     super.onCreate(savedInstanceState);
     setContentView(R.layout.activity_main);

     final Button button = (Button) findViewById(R.id.button);
     final EditText first = (EditText) findViewById(R.id.first_number_et);
     final EditText second = (EditText) findViewById(R.id.second_number_et);
     final TextView answer = (TextView) findViewById(R.id.answer_tv);

     button.setOnClickListener(new View.OnClickListener() {
        @Override
        public void onClick(View v) {
           Integer firstInt = Integer.parseInt(first.getText().toString());
           Integer secondInt = Integer.parseInt(second.getText().toString());
           if (firstInt == secondInt) {
              answer.setText("Равно");
           } else {
              answer.setText("Равно");
           }
        }
     });
  }
}
В этом коде всё просто:
- Находим поля ввода, поле с текстом и кнопку.
- Вешаем на кнопку слушатель нажатий.
- По нажатию на кнопку получаем числа из полей ввода и сравниваем их.
- В зависимости от результата выводим «Равно» или «Не равно».
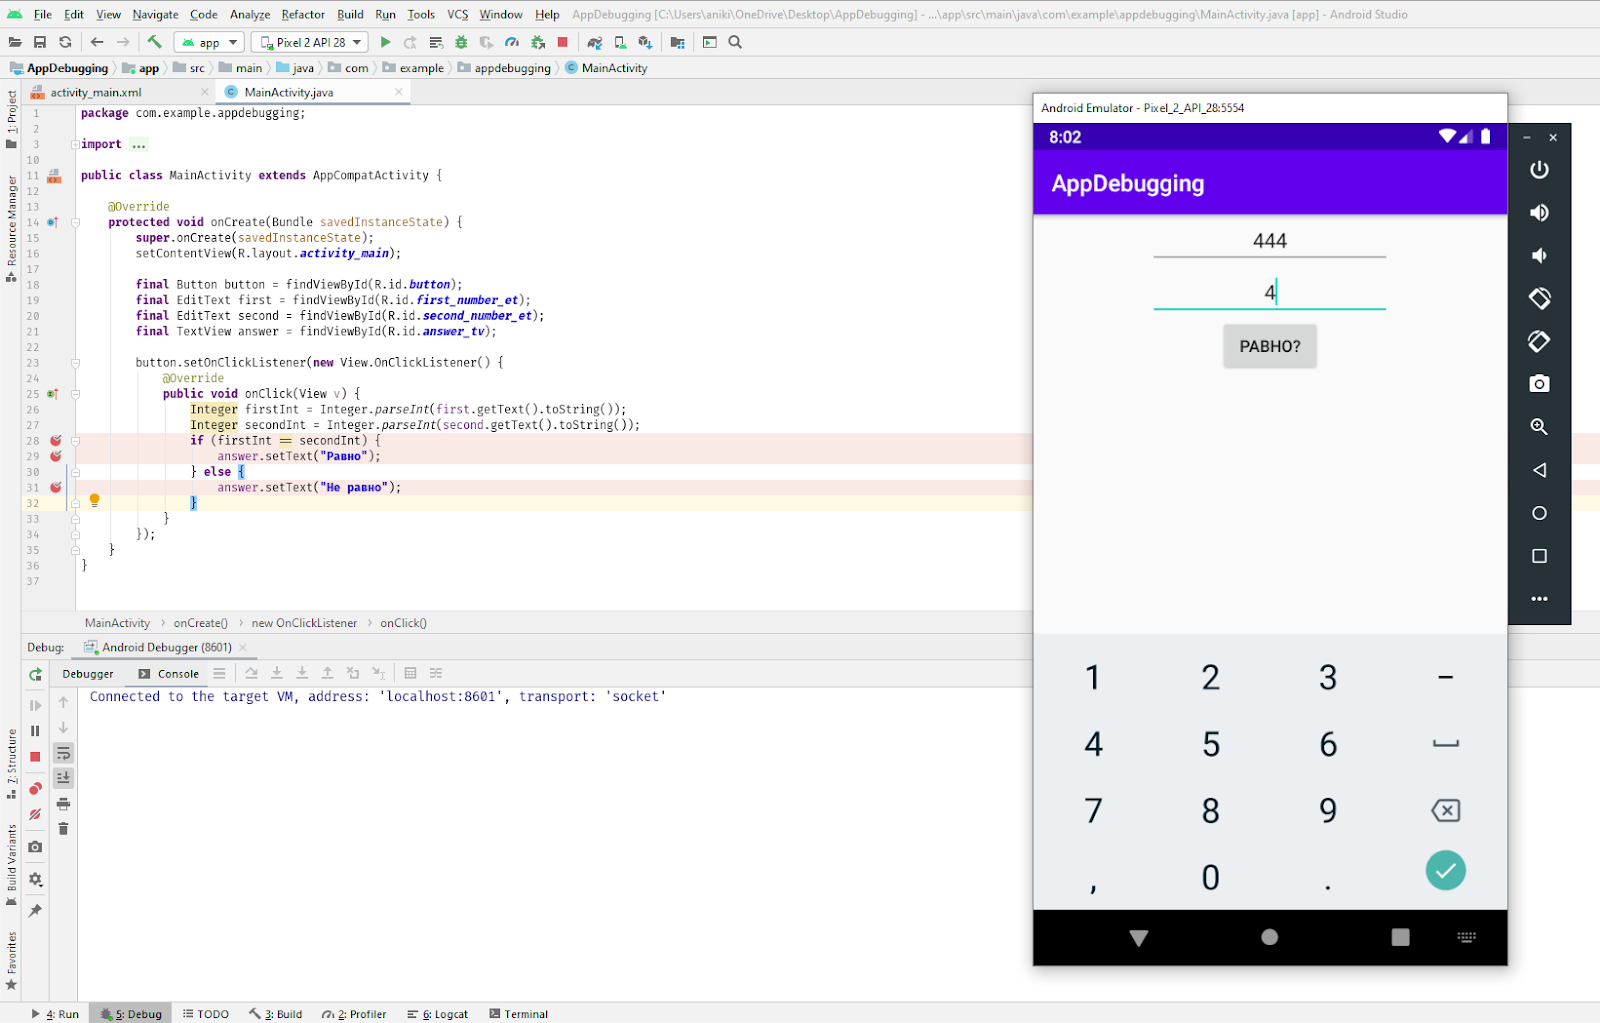
Запустим приложение и введём буквы вместо чисел:
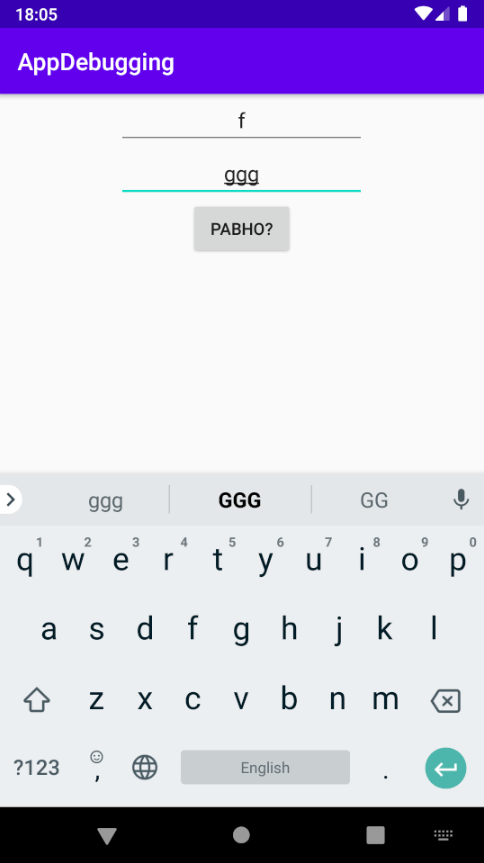
Нажмём на кнопку, и приложение упадёт! Время читать логи. Открываем внизу слева вкладку «6: Logcat» и видим:
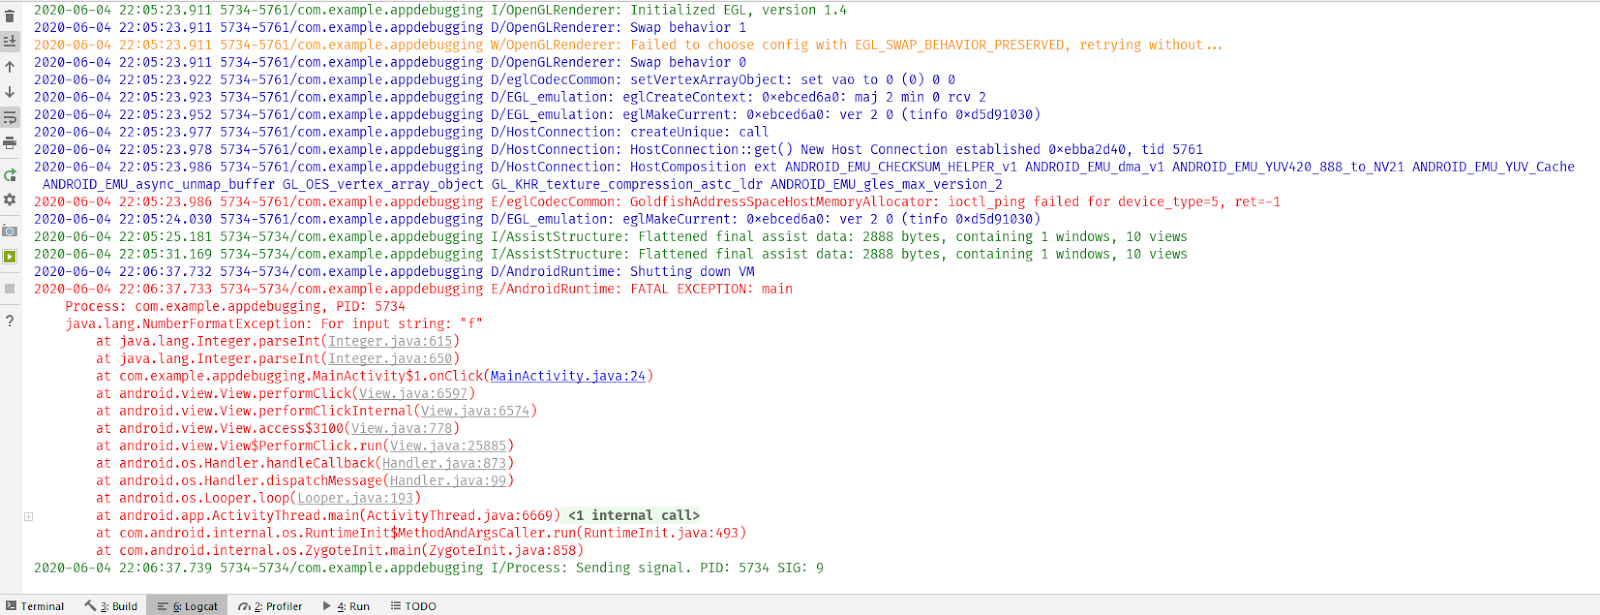
Читать логи просто: нужно найти красный текст и прочитать сообщение системы. В нашем случае это java.lang.NumberFormatException: For input string: «f». Указан тип ошибки NumberFormatException, который говорит, что возникла какая-то проблема с форматированием числа. И дополнение: For input string: «f». Введено “f”. Уже можно догадаться, что программа ждёт число, а мы передаём ей символ. Далее в красном тексте видно и ссылку на проблемную строку: at com.example.appdebugging.MainActivity$1.onClick(MainActivity.java:26). Проблема в методе onClick класса MainActivity, строка 24. Можно просто кликнуть по ссылке и перейти на указанную строку:
int firstInt = Integer.parseInt(first.getText().toString());
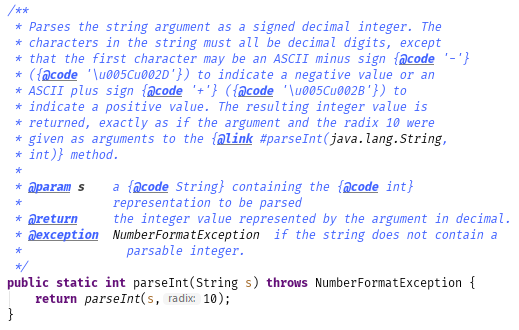
Конечно, метод parseInt может принимать только числовые значения, но никак не буквенные! Даже в его описании это сказано — и мы можем увидеть, какой тип ошибки этот метод выбрасывает (NumberFormatException).
Здесь мы привели один из примеров. Типов ошибок может быть огромное количество, все мы рассматривать не будем. Но все ошибки в Logcat’е указываются по похожему принципу:
- красный текст;
- тип ошибки — в нашем случае это NumberFormatException;
- пояснение — у нас это For input string: «f»;
- ссылка на строку, на которой произошла ошибка — здесь видим MainActivity.java:26.
Исправим эту ошибку и обезопасим себя от некорректного ввода. Добавим в наши поля ввода android:inputType=»number», а остальной код оставим без изменений:
...
<EditText
  android:id="@+id/first_number_et"
  android:layout_width="wrap_content"
  android:layout_height="wrap_content"
  android:ems="10"
  android:gravity="center"
  android:inputType="number"
  app:layout_constraintLeft_toLeftOf="parent"
  app:layout_constraintRight_toRightOf="parent"
  app:layout_constraintTop_toTopOf="parent" />

<EditText
  android:id="@+id/second_number_et"
  android:layout_width="wrap_content"
  android:layout_height="wrap_content"
  android:ems="10"
  android:gravity="center"
  android:inputType="number"
  app:layout_constraintLeft_toLeftOf="parent"
  app:layout_constraintRight_toRightOf="parent"
  app:layout_constraintTop_toBottomOf="@+id/first_number_et" />
...
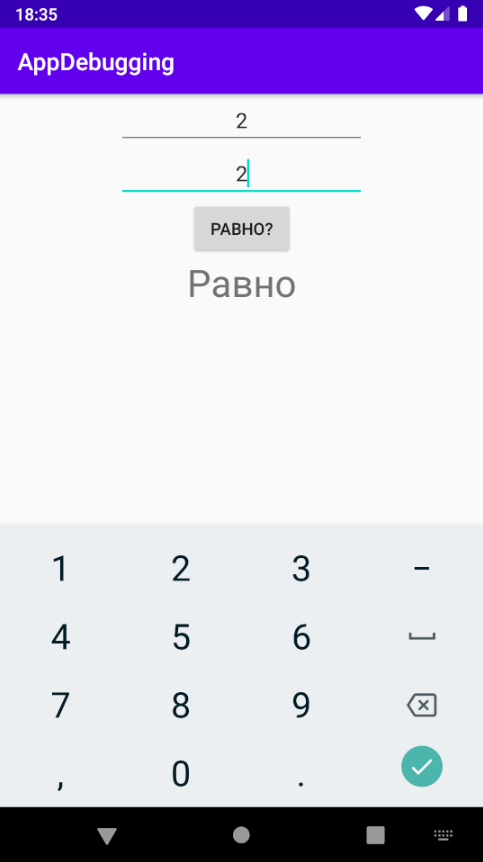
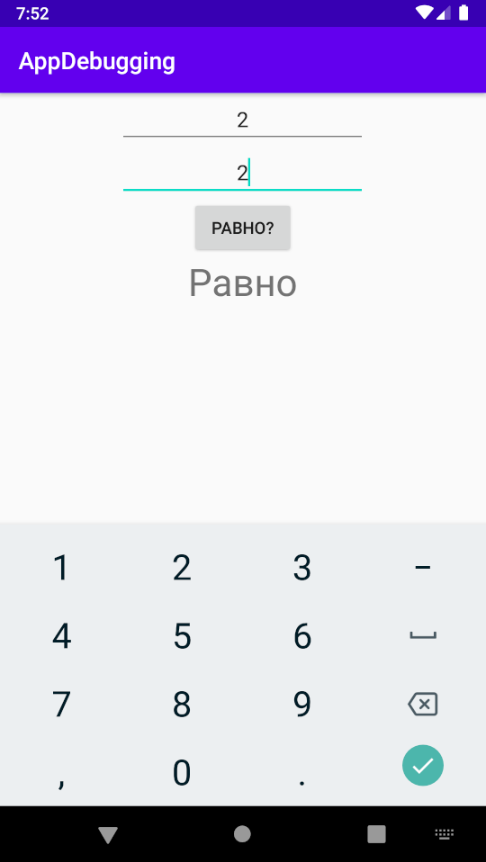
Теперь можем вводить только числа. Проверим, как работает равенство: введём одинаковые числа в оба поля. Всё в порядке:
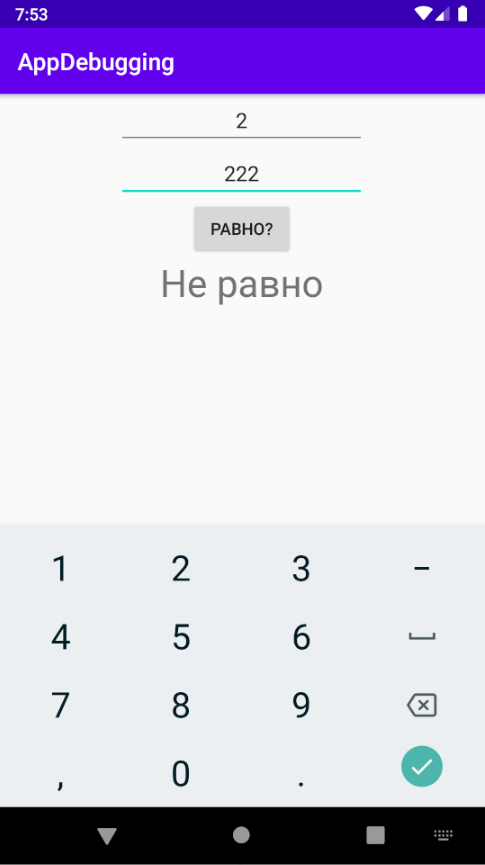
На равенство проверили. Введём разные числа:

Тоже равно. То есть приложение работает, ничего не падает, но результат не совсем тот, который требуется. Наверняка вы и без дебаггинга догадались, в чём ошибка, потому что приложение очень простое, всего несколько строк кода. Но такие же проблемы возникают в приложениях и на миллион строк. Поэтому пройдём по уже известным нам этапам дебаггинга:
- Воспроизведём ошибку: да, ошибка воспроизводится стабильно с любыми двумя разными числами.
- Подумаем, где может быть ошибка: наверняка там, где сравниваются числа. Туда и будем смотреть.
- Исправим ошибку: сначала найдём её с помощью дебаггера, а когда поймём, в чём проблема, — будем исправлять.
И здесь на помощь приходит отладчик. Для начала поставим точки останова сразу в трёх местах:
Чтобы поставить или снять точку останова, достаточно кликнуть левой кнопкой мыши справа от номера строки или поставить курсор на нужную строку, а затем нажать CTRL+F8. Почему мы хотим остановить программу именно там? Чтобы посмотреть, правильные ли числа сравниваются, а затем определить, в какую ветку в нашем ветвлении заходит программа дальше. Запускаем программу с помощью сочетания клавиш SHIFT+F9 или нажимаем на кнопку с жучком:
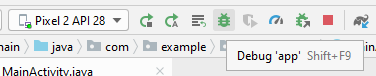
Появится дополнительное окно, в котором нужно выбрать ваш девайс и приложение:
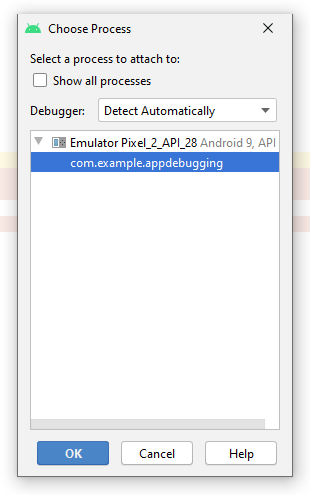
Вы в режиме дебага. Обратите внимание на две вещи:
- Точки останова теперь помечены галочками. Это значит, что вы находитесь на экране, где стоят эти точки, и что дебаггер готов к работе.
- Открылось окно дебага внизу: вкладка «5: Debug». В нём будет отображаться необходимая вам информация.
Введём неравные числа и нажмём кнопку «РАВНО?». Программа остановилась на первой точке:
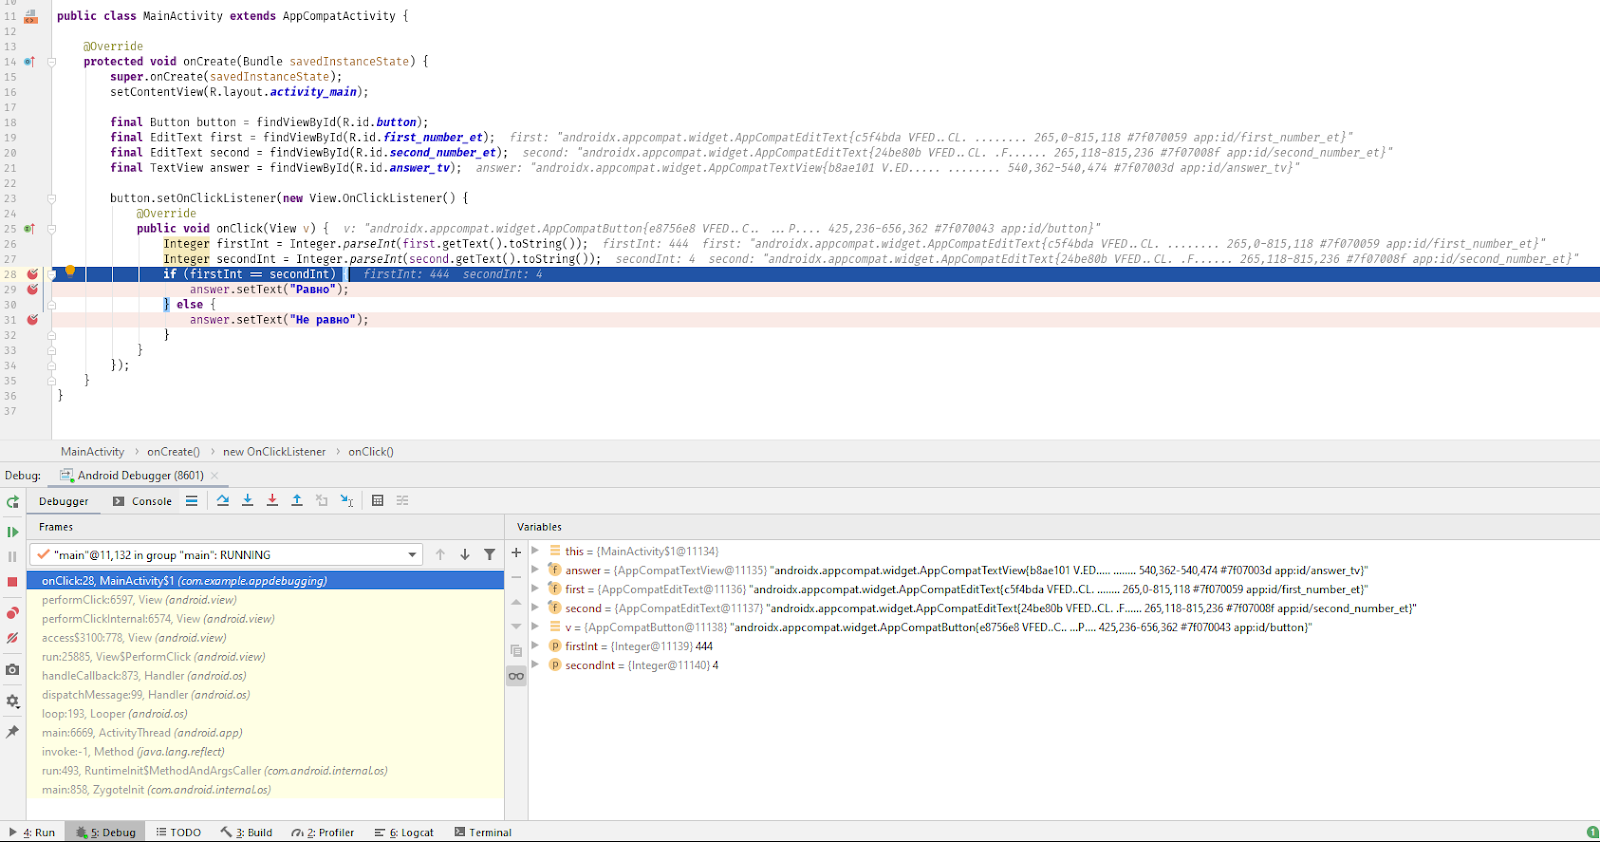
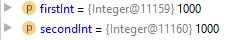
Давайте разбираться:
- Сразу подсвечивается синим строка, где программа остановлена: в окне кода на 28-й строке и в левом окне отладчика (там даже можно увидеть, какой метод вызван, — onClick).
- В правом, основном окне отладчика, всё гораздо интереснее. Здесь можно увидеть инстансы наших вью (answer, first, second), в конце которых серым текстом даже отображаются их id. Но интереснее всего посмотреть на firstInt и secondInt. Там записаны значения, которые мы сейчас будем сравнивать.
Как видим, значения именно такие, какие мы и ввели. Значит, проблема не в получении чисел из полей. Давайте двигаться дальше — нам нужно посмотреть, в правильную ли ветку мы заходим. Для этого можно нажать F8 (перейти на следующую строку выполнения кода). А если следующая точка останова далеко или в другом классе, можно нажать F9 — программа просто возобновит работу и остановится на следующей точке. В интерфейсе эти кнопки находятся здесь:
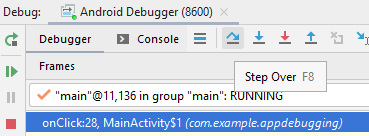
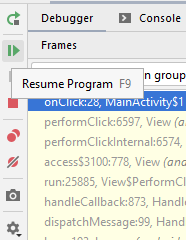
Остановить дебаггер, если он больше не нужен, можно через CTRL+F2 или кнопку «Стоп»:
В нашем случае неважно, какую кнопку нажимать (F9 или F8). Мы сразу переходим к следующей точке останова программы:
Ветка правильная, то есть логика программы верна, числа firstInt и secondInt не изменились. Зато мы сразу видим, что подпись некорректная! Вот в чём была ошибка. Исправим подпись и проверим программу ещё раз.
Мы уже починили два бага: падение приложения с помощью логов и некорректную логику (с помощью отладчика). Хеппи пас (happy path) пройден. То есть основная функциональность при корректных данных работает. Но нам надо проверить не только хеппи пас — пользователь может ввести что угодно. И программа может нормально работать в большинстве случаев, но вести себя странно в специфических состояниях. Давайте введём числа побольше и посмотрим, что будет:
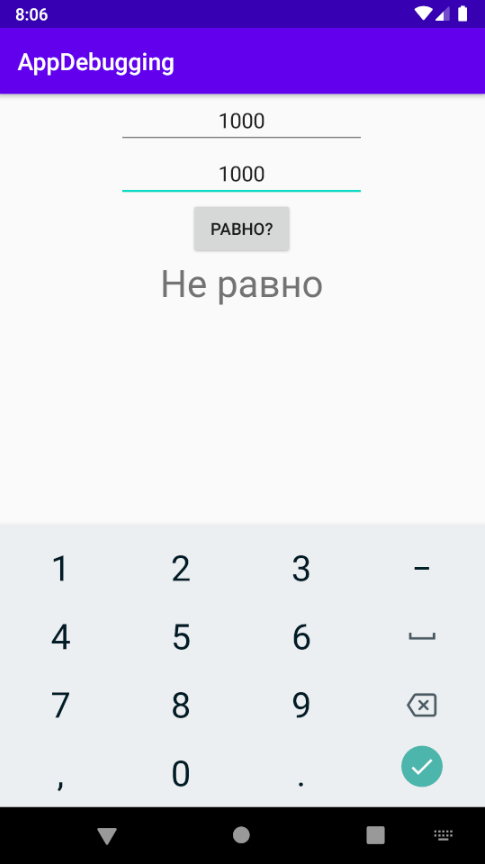
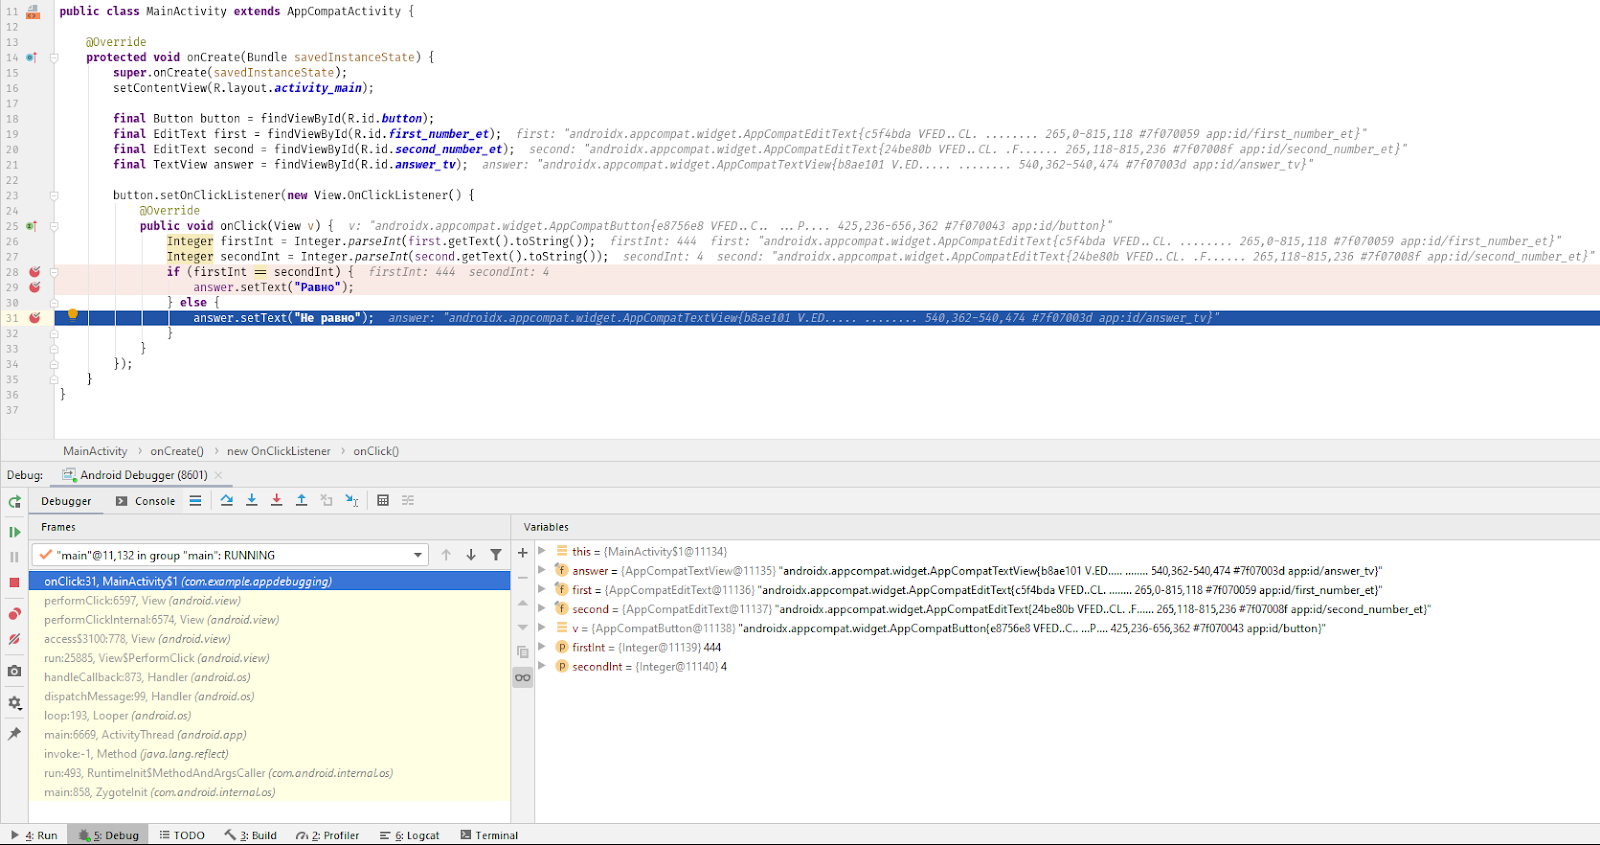
Не сработало — программа хочет сказать, что 1000 не равна 1000, но это абсурд. Запускаем приложение в режиме отладки. Точка останова уже есть. Смотрим в отладчик:
Числа одинаковые, что могло пойти не так? Обращаем внимание на тип переменной — Integer. Так вот в чём проблема! Это не примитивный тип данных, а ссылочный. Ссылочные типы нельзя сравнивать через ==, потому что будут сравниваться ссылки объектов, а не они сами. Но для Integer в Java есть нюанс: Integer может кешироваться до 127, и если мы вводим по единице в оба поля числа до 127, то фактически сравниваем просто int. А если вводим больше, то получаем два разных объекта. Адреса у объектов не совпадают, а именно так Java сравнивает их.
Есть два решения проблемы:
- Изменить тип Integer на примитив int.
- Сравнивать как объекты.
Не рекомендуется менять тип этих полей в реальном приложении: числа могут приходить извне, и тип лучше оставлять прежним. Изменим то, как мы сравниваем числа:
if (firstInt.equals(secondInt)) {
  answer.setText("Равно");
} else {
  answer.setText("Не равно");
}
Проверяем:

Всё работает. Наконец-то! Хотя… Давайте посмотрим, что будет, если пользователь ничего не введёт, но нажмёт на кнопку? Приложение опять упало… Смотрим в логи:
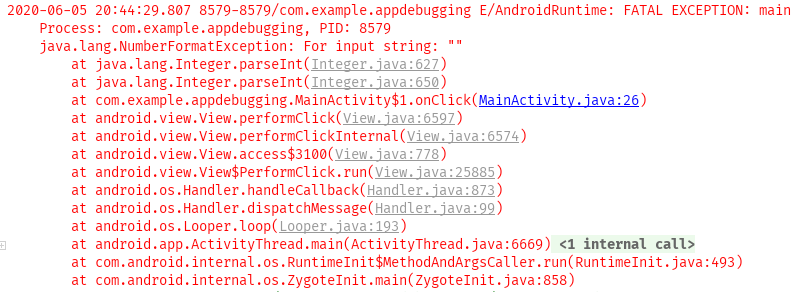
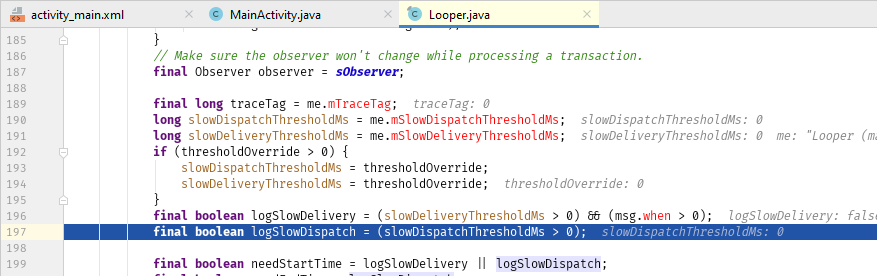
Опять NumberFormatException, при этом строка пустая. Давайте поставим точку останова на 26-й строке и заглянем с помощью отладчика глубже.
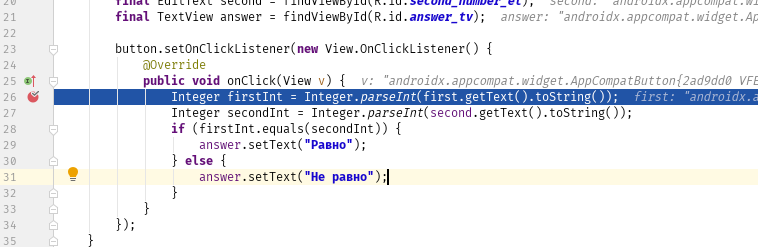
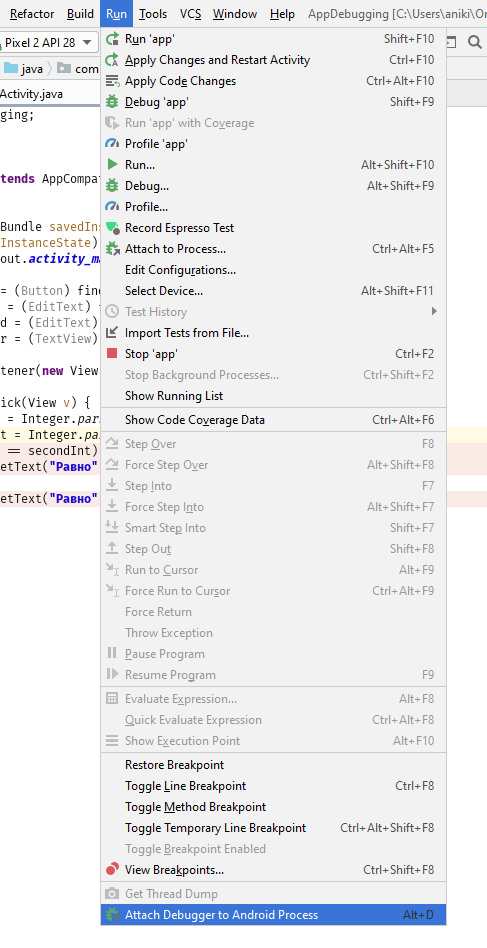
Нажмём F8 — и перейдём в глубины операционной системы:
Интересно! Давайте обернём код в try/catch и посмотрим ошибке в лицо. Если что, поправим приложение. Выделяем код внутри метода onClick() и нажимаем Ctrl+Alt+T:
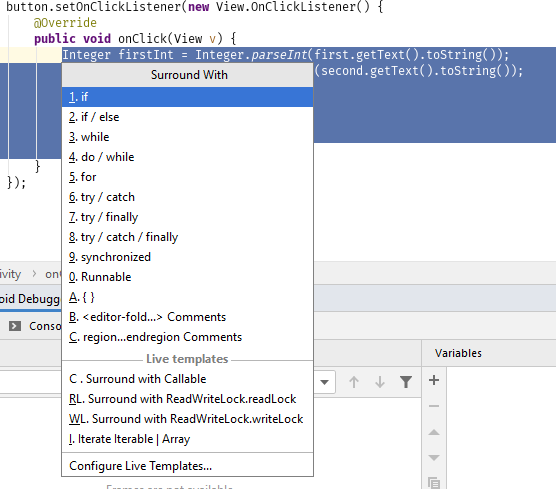
Выбираем try / catch, среда разработки сама допишет код. Поставим точку останова. Получим:
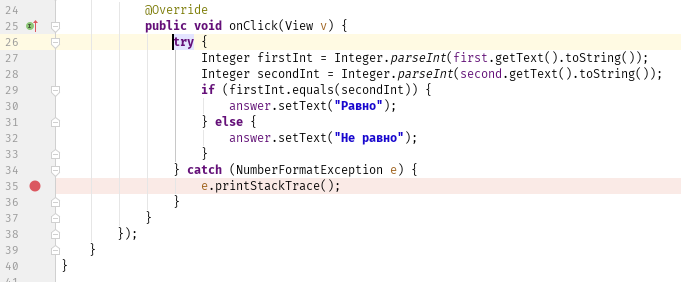
Запускаем приложение и ловим ошибку:
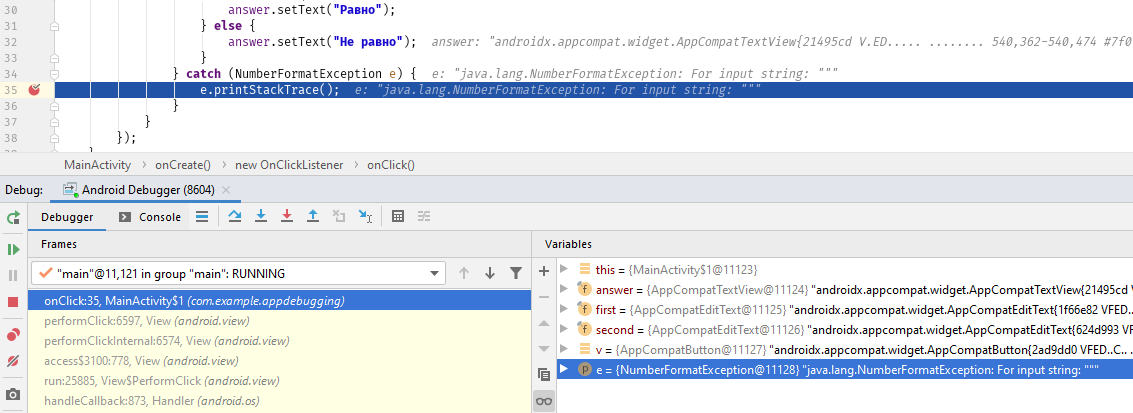
Действительно, как и в логах, — NumberFormatException. Метод parseInt выбрасывает исключение, если в него передать пустую строку. Как обрабатывать такую проблему — решать исключительно вам. Два самых простых способа:
- Проверять получаемые строки first.getText().toString() и second.getText().toString() на пустые значения. И если хоть одно значение пустое — говорить об этом пользователю и не вызывать метод parseInt.
- Или использовать уже готовую конструкцию try / catch:
Теперь-то точно всё в порядке! Хотя профессиональным тестировщикам это приложение никто не отдавал: поищете ещё ошибки?
Log-File locations
There are several directories where logs (including those from crashes) might appear — not all of them are standardized (i.e. some may be ROM-specific).
/data/anr: Some trace files seem to get here (Dalvik writes stack traces here on ANR, i.e. «Application Not Responding» aka «Force-Close»; see e.g. log excerpts here)/data/dontpanicseems to be a standard location (AOSP), and contains some crash logs including traces (see e.g. viaForensics and StackOverflow)/data/kernelpanicsis another location — not having had any «kernel panic» on my Android devices, I saw no content there yet.- the
/data/panic/panic_daemon.configmay point to other locations configured — on my Droid 2 it mentions/sdcard/panic_data/ - mentioned Droid 2 also has a
/data/panicreportsdirectory (empty here) /data/tombstonesmay hold severaltombstone_nnfiles (withnnbeing a serial, increased with every new file). As tombstones are placed for the dead, it is done here for «processes died by accident» (i.e. crashed) — and it is what is referred to as «core dumps» on Linux/Unix systems. However, not all apps create tombstones; this must be explicitly enabled by the developer (see Debugging Android Core Dumps).
There may be some more locations which escaped me; but as most logging is done on tmpfs, these data are lost with a reboot, and would not match the OPs question.
Log commands to use with a terminal app (or adb)
Several commands can get you tons of information. For most of them, it is to recommend to re-direct them to a file (> filename.ext) or pipe them through a filter (| grep search-for-this):
Kernel log
The following works without root:
$ dmesg
<6>[82839.126586] PM: Syncing filesystems ... done.
<7>[82839.189056] PM: Preparing system for mem sleep
<4>[82839.189361] Freezing user space processes ... (elapsed 0.05 seconds) done.
<4>[82839.240661] Freezing remaining freezable tasks ... (elapsed 0.00 seconds) done.
<snip>
Logcat
Here you can e.g. specify what area you are interested in — radio, events…
# logcat -b events
I/am_create_service( 3457): [1085416560,nitro.phonestats/.widget.WidgetProvider4x1$WidgetUpdateService4x1,,3721]
I/am_destroy_service( 3457): [1085416560,nitro.phonestats/.widget.WidgetProvider4x1$WidgetUpdateService4x1,3721]
I/notification_cancel( 3457): [nitro.phonestats,4,0]
<snip>
Getting device info
And tons of it: Device specifics, account information, services…
$ dumpsys
Currently running services:
  LocationProxyService
  SurfaceFlinger
  accessibility
  account
  activity
<snip>
DUMP OF SERVICE account:
Accounts:
  1 Account {name=xxxxxxx@googlemail.com, type=com.google}
<snip>

$ dumpstate
========================================================
== dumpstate: 2012-08-18 23:39:53
========================================================

Build: Gingerbread GWK74 - CyanogenMilestone2
Bootloader: 0x0000
Radio: unknown
<snip>
------ MEMORY INFO (/proc/meminfo) ------
MemTotal: 487344 kB
MemFree: 10436 kB
<snip>
All-in-One
Make a big ball with everything together, from logcat to dumpstate:
$ bugreport > /mnt/sdcard/bugreport.txt
I’m pretty sure you really want to redirect that last command… xD
Something about permissions
P.S.: Naturally, access to those information may require root, as most of the sources are located on internal storage.