
Ingenious Guide to View Log File of SQL Server

Microsoft SQL Server application is one of the biggest waves in the relational database management system and handles huge databases in a well-structured manner. However, when it comes to viewing SQL Server log files, some users face trouble. We are sure that you must be aware of how good the MS SQL Server database is for both beginners as well as expert users.
But, Digital Crimes Can Takes Place In SQL Server Too!!!!
Nowadays, Ex-employees or hackers intentionally modifies the values of databases in order to damage the organization assets. And it becomes difficult to analyze or examine who is the culprit manually. As a result, the Organizations run into big trouble.
Hold On!! There Is A Good News
In SQL Server, there is a transaction Log file that keep records of all transactions & modifications in database executed on a database in a Microsoft SQL Server. By reading the Log file, one can easily check who deleted data from table in SQL Server database. Plus, it is used by forensic investigator to examine SQL Server Transaction Log and view & check every log detail in a detailed manner. In short, with SQL Log file, it becomes easy to find out which query performed on which table at what time.
Here, we are going to answer how to view log file of SQL Server by using various workarounds. Just go through this article once and understand how to open or read transaction log file in Microsoft SQL Server 2017 / 2016 / 2014 / 2012 / 2008 / 2008 R2 / 2005.
Moreover, if user want to restore the deleted query from a log file, then they can go through this blog – How to Recover Data from Log file in SQL Server – A Complete Guide .
Now, first of all, users need to find out the location of the log files. Then only they can proceed with a desired solution. So, to understand where your log files are, simply follow the below steps:
- Open SSMS & Connect to SQL Instance.
- Go to Management >> SQL Server Logs.
- Now, View the Log & Archive Logs simply.

Methods Use For How to View Transaction Log File of SQL Server
In the following section, you will understand how to open, check and read transaction file to retrieve information about the data which had been altered. Before we move on towards the solution, let’s look at the ways to find the location of SQL logs easily. So, let’s get started!!
As users saw the location of the log files, let’s move ahead. From the start of SQL Server or manual log file recycling, users can use these logs to view recent activities.
1st Method – xp_readerrorlog() function
Users can use the extended xp_readerrorlog process to find the current location of the log file.
USE master
GO
xp_readerrorlog 0, 1, N'Logging SQL Server messages', NULL, NULL,NULL
GO
Now, we have some predefined guidelines for this procedure as mentioned below:
- End-time
- from time
- Search string1
- Search string 2
- Sort results – Ascending (N’ASC) or descending (N’Desc)
- Error log file: value 0 for the current, 1 for Archive#1, 2 for Archive #2
- Logfile type: Value 0 for SQL Server error log, 1 for SQL Server Agent log
Just as an example: The log file location is C:Program FilesMicrosoft SQL ServerMSSQL14.MSSQLSERVERMSSQLLogERRORLOG. Now users can see these files easily.

2nd Method – SERVERPROPERTY() function
Search the SERVERPROPERTY query to find the location of your SQL Server Log files.
SELECT SERVERPROPERTY('ErrorLogFileName') AS 'Error log location'

#Approach 1: Use Log File Viewer in SQL Server Management Studio
Basically, this method exclusively used to open and view the information about following logs in SSMS:
- Audit Collection
- Database Mail
- Job History
- Data Collection
- SQL Server
- SQL Server Agent
- Windows Events
Its prime function of Log File Viewer is to provide the report of activities taken place in SQL Server Management Studio. In fact, one can open the Log File Viewer wizard in different ways on the basis of information that you want to check. Now, go through the instructions to view log details in SQL Server.
How to View Log File of SQL Server Via. Log File Viewer
Step-1. Open Microsoft SQL Server Management Studio application. Here, we are using SQL Server 2014 environment for reading SQL Server Error Log.

Step-2. Connect to Server windows pops-up. Here, you need to select the Server Name and Type of Authentication. Afterward, click on Connect.

Step-3. In Object Explorer, go to Management as shown in the screenshot to examine or read log file of SQL Server 2014.

Step-4. Now, move to SQL Server Logs option.

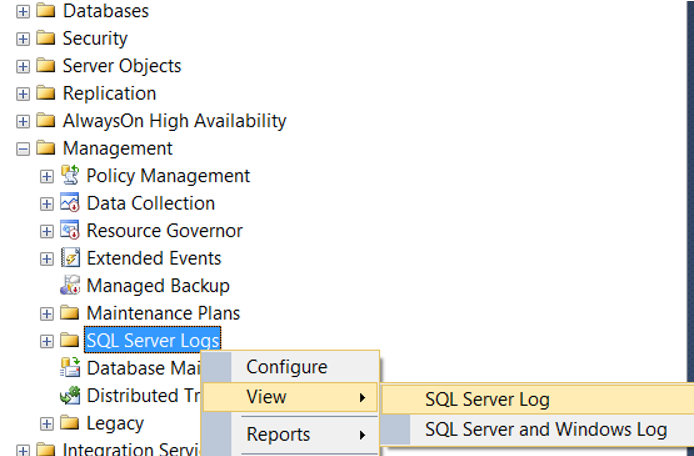
Step-5. Now, Right-click on SQL Server Logs and select View >> SQL Server Log sequentially.

Step-6. All the Log summary displayed on Log File Viewer window. Here, you can select other logs such as SQL Server Agent , Database Mail from the left panel to check its information too.

#Approach 2: View Log File of SQL Server Via. Undocumented fn_dblog()
Originally, the function fn_dblog() is used to extract data from Transaction file of SQL Server for forensic purposes to analyze every log event performed on the table. So, let’s check out how to read transaction log file in Microsoft SQL Server 2017 / 2016 / 2014 / 2012 / 2008 / 2008 R2 / 2005 editions.
Steps to View Log File in SQL Server Using Fn_dblog()
Step 1: We have a table named as ‘Employee’. So, first view the values of the table using the following T-SQL.Select * from employee.

Step 2: Afterward, alter the table data using update command. For this, execute the query;Update employee set department ='IT' where emp_name = 'jeevan'

Step 3: Again, view the table values using the Select Query. Now, you can see a modified table.

Step 4: Run the fn_dblog function according to the need. Here, we execute the query to check out the time when update operation was executed.
Select [Begin Time], [Transaction Name] from fn_dblog(null , null) where [Transaction Name] = ‘Update’

Step 5: In a situation, when you want to analyze all the logs such as Delete etc. , then run the following T-SQL query.
Select [Begin Time], [Transaction Name] from fn_dblog(null, null)
However, there are some consequences attached with fn_dblog(). Actually, this function only provide the time of the query when it was committed instead of which data entry gets affected. Due to which, it becomes cumbersome to find out which table data get altered.
This problem is overcome with the third technique where user can view the log file of SQL Server without any hassle. Apart from this, both the described technique can run in SQL Server Management Studio only. You cannot read a Transaction Log File in offline environment with Log File Viewer and Fn_dblog().
#Approach 3: Use Smart Solution to Analyze Transaction File Easily
To get exact information from SQL Log File, take the help of SysTools SQL Log Reader Software. With the help of this software, user can scan and analyze T-log file in human readable format. However, the tool works in Online as well as Offline environment. User can get the information like Transaction , Login Name , Time , Table Name , Query . It is a best software solution that answers the question – how to read SQL Server Transaction Log file.
Download Free SQL Log Analyzer
Related : How to Fix Log File Corruption – Step-By-Step Guide
In fact, after viewing the log file of SQL Server, user can export the query in Live SQL Server database environment , SQL Compatible Scripts , and in CSV format. Moreover , the software can read Transaction log file of every SQL Server edition.
Conclusion
That’s all about how to View Log file of SQL Server. Now, go through the above-mentioned methods and opt for the best that is suitable for you and examine the SQL Server Transaction Log file without any hassles at all. Make sure that you are confident while executing the manual method or simply go for the automated solution.
Also Read: SQL Server Transaction Log Forensics
Frequently Asked Questions
How to open SQL Server database Transaction Log file (.ldf) in readable format?
Try SQL Log Analyzer tool to easily scan and read the Transaction .ldf file records.
How to view SQL Log file in SSMS?
Use Fn_dblog() function to read the details of transaction in SQL Server.
Can I read log file of SQL Server 2008?
With the help of SQL Log Viewer, one can read .ldf file and view Transaction, Transaction time, Table name and Query of Microsoft SQL Server 2017, 2016, 2014, 2012, 2008 and SQL Server 2005
Is it possible to examine SQL Transaction Log file?
Yes, with the help of mentioned workaround, one can easily examine SQL LDF file.
April 13, 2019
MSSQL, Windows
SQL Server Logs and Operating System Logs(Event Logs) are logs that SQL Server Database Administrators checks on a daily basis, or use to find the cause of the error when they encounter an error. In this article, we will learn how to check these logs.
Through SSMS, you can access both logs from the View tab by right-clicking SQL Server Logs under Management as follows.
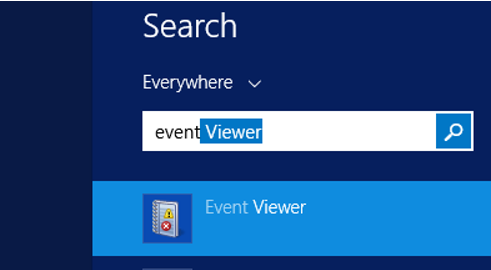
You can also access the operating system logs from the Event Viewer on Windows. To access the event viewer, go to Run->Search and write “Event Viewer”.
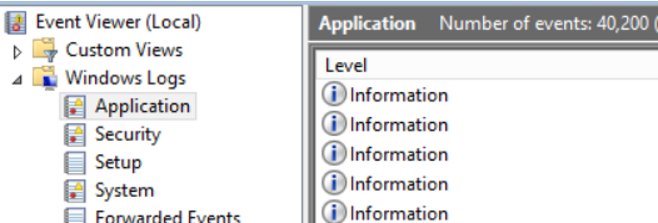
When we open the Event Viewer, a screen appears as below. You can find logs from the tabs under Windows Logs.
If you want to filter SQL Server Error Log, I suggest you to read the below article.
“How To Filter SQL Server Error Log(Like or Not Like)”
![]()
SQL server maintains its own informational and Error events in Error log. The SQL Server error log is a great place to find the information what is happening in your database. SQL Server error log maintain information about failures/ Success and Errors that
occurred in the database since SQL Server was last restarted or since the last time you have recycled the error logs. SQL Server error log contains user define events and certain system events.
By default there are 6 Archived error logs and 1 Current error log available in SQL Server instance.

By default error Log available in the location C:Program FilesMicrosoft SQL ServerMSSQL10.MSSQLSERVERMSSQLLog
In the above path the filename called ERRORLOG is the currently using error log and 6 archived error logs are like ErrorLog.1, ErrorLog.2 to ErrorLog.6.
How to configure number of Error log to be maintained by SQL Server.
SQL Server management studio -> Management -> SQL Server Logs


Here can increase SQL Server error log up to 99 files.
How to start new SQL Server error log file.
Every time SQL server restart will start with new SQL server error log with name ERRORLOG and old file are renamed to ErrorLog.1, ErrorLog.1 and soon.
Here method to create new error log without server restart.
Exec sp_cycle_errorlog
Go
Before Sp_cycle_errorlog

After Sp_cycle_errorlog

Get Size of 6 default log files
EXEC master..sp_enumerrorlogs
Go
Log file data in Table
xp_readerrorlog
Have a nice day!!
The SQL Server Error Log is one of the most useful thing to troubleshoot database server issues. System errors get logged here along with a host of other useful information.
Read on to see how to understand, analyze, and manage the SQL Server Error Log…
Why Should You Care About Reading This Log?
So why should you care at all about the error log? While it is true that the Windows Events Logs contains many useful bits of information, the more specific errors get written to the SQL Server error log. Are you troubleshooting issues on your SQL Instance? If so then reading and understanding this log will immensely help.
The SQL Server Error Log:
- Wealth of information about the SQL Instance
- A great source of troubleshooting information
- The answers are often in the logs – you just have to read them
RTFM – The Truth is Out There!

There is a very old retort that has been around since the early Unix days for when n00bs ask questions on message boards: RTFM. Developers can be harsh spoken and system administrators can be thick skinned. Learning a programming language, for example, is a tough task. There become a lot of elementary questions asked and some people get turned off by the curt responses. The truth of the matter is that there is no substitute for reading the documentation.
Professionals who contribute to forums don’t want to do your homework or provide free consulting for such basic things. You really need to put in some work first and then present what you’ve got and ask your question.
There is no substitute for reading logs to understand behavior
Reading logs is not sexy. For non-robots it can be boring and tedious. However the SQL Server error log is a goldmine of useful information to troubleshoot your SQL Server Instance. Are you getting crash dumps? Deadlocks? Connectivity issues? Services crashing? Corruption? All of these can be discerned from analyzing the error log. You would do well to have this skill!
Here’s my favorite xkcd comic showing what happens when you don’t read the documentation:

Anatomy of SQL Server Error Log
Now let us examine the parts which comprise the error log.
There are a few ways to find and view the error log.
- SSMS
- T-SQL
- File System
SQL Server Management Studio
In SSMS you can find it in the object browser. Here it is:

From here you can double click on the current error log and open it up. You will see something like this:

You can filter the log as such:

The output will look like this:

Go ahead and export to a file. Play around with it and get familiar with reading these logs.
T-SQL
SQL Server 2005 introduced a new undocumented command: sp_readerrorlog. This allows us to query the error log which can be powerful.
A word of caution – undocumented means Microsoft can change or remove it anytime and does not provide support for this command.
It is a wrapper around an extended procedure called xp_readerrorlog. You can know this by querying:
--show definition of procedure
exec sp_helptext sp_readerrorlog
Output:

Here are some examples of querying the error log:
exec sp_readerrorlog; --show the full most recent error log
exec sp_readerrorlog 1; --choose the next youngest log (default is 0 meaning current)
exec sp_readerrorlog 0, 1 --show current error log with log file type (same as the first command)
exec sp_readerrorlog 0, 1, 'error'; --grep current error log for keyword
exec sp_readerrorlog 0, 1, 'error', 'logging'; --an additional search parameter to refine
File System
My preferred method of accessing and analyzing the error log is by way of the file system.
How do we know where the file is? By default, the error log is located at Program FilesMicrosoft SQL ServerMSSQL.nMSSQLLOGERRORLOG and ERRORLOG.n files. Sometimes a DBA will move it and we need to look harder. You can always just search the file system in Windows Explorer for “ERRORLOG”.
Using the SQL Server Configuration Manager:

You see the services running for SQL Server. Right click on the service for your instance and look at the startup parameters. This is the path where your log files are likely to be.

Additionally you can query the log location in T-SQL:
--query error log location
SELECT SERVERPROPERTY('ErrorLogFileName') AS 'Error log file location';
Structure of Error Log
Besides errors you can learn a lot about an instance by reading some of the beginning lines.

Just by reading the first 35 lines I can discern:
- The exact version and build of SQL Server
- The OS version and build
- Time zone
- Authentication mode
- Default locations for log files
- CPU recognized
- Memory allocated
- Collation
- IFI
If you knew nothing about a server this can tell quite a lot!
How to Manage the Error Log
There are 2 options to be aware of when managing the error log:
- Cycling the log
- Controlling the size of the log
By default the error log will create 7 log files to cycle through. When you add an eighth it drops the oldest one and renames the rest accordingly. The first “ERRORLOG” is the current one always.
Every time the SQL Server service is restarted a new error log file is created
Cycling the Error Log
We can cycle the error logs (meaning create a new one and push the last out of the queue) by using sp_cycle_errorlog:
--cycle the error log
exec sp_cycle_errorlog;
Here are the log files before running the command:

…and after:

NOTE: I accidentally ran it twice – that is why there are 2 new logs created.
Under the covers this command runs dbcc errorlog.
Controlling the Size of the Error Log
To change the size that an error log file can be you need to make a change in the registry. The Microsoft documentation shows the key we are interested in:
HKEY_LOCAL_MACHINESOFTWAREMicrosoftMSSQLServerMSSQLServerNumErrorLogs
PROTIP: Always back up the registry BEFORE making any changes!
Understanding the Error Log
Some of these logs can get very big and appear hard to analyze. You need to know the important bits to examine and search. I like to do it this way:
- Find and open the Error Log in Notepad++ (or your favorite text editor)
- Ctrl + F to enter a search term
- Click “Find All in Current Document”
Now you can easily analyze the file. Double click on the line in the output to go straight to it in the file.

Notice you can use regular expressions – they are your friend when searching text.
I like to search out the following terms on the regular:
- severity:
- crash
- dump
- deadlock
- victim
- fatal
Searching on “severity:” tends to show useful output
Don’t just search for “error” because you will get a lot of false positives that you may not care about. I have the best luck with “severity:” because I can evaluate what is important and it reduces noise.
Well there you have it. Get your hands dirty in the log and you will level up your skills.
Thanks for reading!
If you liked this post then you might also like: Stop and Think Before You Shrink – Shrinking a SQL Server Database
Просмотр журнала ошибок SQL Server в среде SQL Server Management Studio (SSMS)
В журнал ошибок SQL Server записываются пользовательские и определенные системные события, которые могут пригодиться при устранении неполадок.
Просмотр журналов
В среде SQL Server Management Studio выберите элемент Обозреватель объектов. Чтобы открыть обозреватель объектов, нажмите клавишу F8. Либо в главном меню щелкните Вид и выберите пункт Обозреватель объектов:

В обозревателе объектов подключитесь к экземпляру SQL Server и разверните его.
Найдите и разверните раздел Управление (при условии, что у вас есть разрешения на его просмотр).
Щелкните элемент Журналы SQL Server правой кнопкой мыши, выберите пункт Вид, а затем журнал SQL Server.

Появится средство просмотра журнала (возможно, придется немного подождать) со списком журналов для просмотра.
Открытие средства просмотра файла журнала
Средство просмотра журнала используется в среде SQL Server Management Studio для доступа к сведениям об ошибках и событиях, записываемых в следующие журналы.
Агент SQL Server
События Windows (К ним можно получить доступ с помощью программы просмотра событий Windows.)
Начиная с SQL Server 2012 (11.x), в списке «Зарегистрированные серверы» можно просматривать файлы журналов SQL Server на локальных и удаленных экземплярах SQL Server. В списке «Зарегистрированные серверы» можно просматривать файлы журнала как для экземпляров в сети, так и для экземпляров вне сети. Дополнительные сведения о доступе в сети см. далее в разделе «Просмотр файлов журнала в сети с зарегистрированных серверов». Дополнительные сведения о доступе к автономным файлам журнала SQL Server см. в разделе Просмотр автономных файлов журнала.
Открыть средство просмотра журнала можно несколькими способами (в зависимости от того, какие сведения нужно просмотреть).
Разрешения
Чтобы получить доступ к файлам журнала для экземпляров SQL Server , которые находятся в сети, требуется членство в предопределенной роли сервера securityadmin.
Чтобы получить доступ к файлам журнала для экземпляров SQL Server , которые находятся вне сети, необходим доступ на чтение к пространству WMI RootMicrosoftSqlServerComputerManagement10 , а также к папке, в которой хранятся файлы журнала. Дополнительные сведения см. в подразделе «Безопасность» раздела Просмотр автономных файлов журнала.
Безопасность
Требуется членство в предопределенной роли сервера securityadmin.
Просмотр файлов журнала
Просмотр журналов, связанных с общими операциями SQL Server
В обозревателе объектов разверните узел Управление.
Выполните одно из приведенных ниже действий.
Щелкните правой кнопкой мыши Журналы SQL Server, выберите Просмотр, а затем Журнал SQL Server или Журнал SQL Server и Windows.
Разверните узел Журналы SQL Server, щелкните правой кнопкой мыши любой файл журнала и выберите Просмотреть журнал SQL Server. Можно также дважды щелкнуть любой файл журнала.
Доступны журналы Компонент Database Mail, SQL Server, Агент SQL Serverи Windows NT.
Просмотр журналов, связанных с заданиями
В обозревателе объектов откройте Агент SQL Server, щелкните правой кнопкой мыши Заданияи выберите Просмотр журнала.
Доступны журналы Компонент Database Mail, Журнал заданийи Агент SQL Server.
Просмотр журналов, связанных с планами обслуживания
В обозревателе объектов раскройте узел Управление, щелкните правой кнопкой мыши Планы обслуживанияи выберите Просмотр журнала.
Доступны журналы Компонент Database Mail, Журнал заданий, Планы обслуживания, План удаленного обслуживанияи Агент SQL Server.
Просмотр журналов, связанных с коллекциями данных
В обозревателе объектов раскройте узел Управление, щелкните правой кнопкой мыши Сбор данныхи выберите команду Просмотреть журналы.
Доступны журналы Сбор данных, Журнал заданийи Агент SQL Server.
Просмотр журналов, связанных с компонентом Database Mail
В обозревателе объектов раскройте узел Управление, щелкните правой кнопкой мыши Компонент Database Mailи выберите команду Просмотреть журнал компонента Database Mail.
Доступны журналы Компонент Database Mail, Журнал заданий, Планы обслуживания, Планы удаленного обслуживания, SQL Server, Агент SQL Serverи Windows NT.
Просмотр журналов, связанных с коллекциями аудитов
В обозревателе объектов разверните узел Безопасность, затем узел Аудиты, щелкните правой кнопкой мыши аудит и выберите команду Просмотреть журналы.
Доступны журналы Коллекция аудитов и Windows NT.
Анализ работы MS SQL Server, для тех кто видит его впервые
Недавно столкнулся с проблемой — занедужил SVN на ubuntu server. Сам я программирую под windows и с linux “на Вы”… Погуглил по ошибке — безрезультатно. Ошибка оказалась самая типовая (сервер неожиданно закрыл соединение) и ни о чем конкретном не говорящая. Следовательно, надо погружаться глубже и анализировать логи/настройки/права/и т.п., а с этим, как раз, я “на Вы”.
В результате, конечно, разобрался и нашел всё что нужно, но время потрачено много. В очередной раз думая, как глобально (да-да, во всём мире или хотя бы на ⅙ части суши) уменьшить бесполезно потраченные часы — решил написать статью, которая поможет людям быстро сориентироваться в незнакомом программном обеспечении.
Писать я буду не про линукс — проблему хоть и решил, но профессионалом вряд ли стал. Напишу про более знакомый мне MS SQL. Благо, уже приходилось много раз отвечать на вопросы и список типовых уже готов.
Для кого пишу
Если вы админ в Сбере (или в Яндексе или <другая топ-100 компания>), вы можете сохранить статью в избранное. Да, пригодится! Когда к вам, в очередной раз, с одними и теми же вопросами придут новички — Вы дадите им ссылку на нее. Это сэкономит Ваше время.
Если без шуток, эта СУБД часто используется в небольших компаниях. Часто совместно с 1С либо другим ПО. Отдельного БД-админа таким компаниям держать затратно — надо будет выкручиваться обычному ИТ-шнику. Для таких и пишу.
Какие проблемы рассмотрим
Если сервер вам сообщает “закончилось место на диске Е” — глубокий анализ не нужен. Не будем рассматривать ошибки, решение которых очевидно из текста сообщения. Также не будем рассматривать ошибки по которым гугл сразу выдает ссылку на msdn с решением.
Рассмотрим проблемы по которым не очевидно что гуглить. Такие как, например, внезапное падение производительности или, например, отсутствие соединения. Рассмотрим основные инструменты для настройки. Рассмотрим средства анализа. Поищем где лежат логи и другая полезная информация. И в целом, попробую в одной статье собрать нужную информацию для быстрого старта.
Самое первое
Начнем с лидера списка частых вопросов, настолько он опережает всех, что рассмотрим его отдельно. Вдобавок, об этом пишут во всех статьях про работу MS SQL — и я не буду нарушать традицию.
Если у вас вдруг, ни с того ни с сего, стало работать медленно, а вы ничего не меняли (как поставили, так всё и работало, никто ничего не трогал) — в первую очередь, обновите статистику и перестройте индексы. Только удостоверившись, что это выполнено — имеет смысл копать глубже. Еще раз подчеркну — делать это нужно обязательно, вопрос только как часто.
В интернете полно рецептов как это делать, приводятся примеры скриптов. Предположу, что все те методы для “профи” и новичкам непонятны. Что ж, опишу способ наипростейший: для его внедрения вам потребуется только владение мышью.
- SSMS — приложение “Microsoft SQL Server Management Studio”, находится в “Пуске”. Устанавливается отдельной галочкой (Client management tools) с дистрибутива сервера. Начиная с 2016 версии, доступно бесплатно на сайте MS в виде отдельного приложения. Старшие версии студии нормально работают с младшими версиями сервера. Наоборот — тоже иногда работают (основные функции).
docs.microsoft.com/en-us/sql/ssms/download-sql-server-management-studio-ssms “SSMS is free! It does not require a license to install and use.” - Profiler — приложение “SQL Server Profiler”, находится в “Пуске”, устанавливается вместе с SSMS.
- Performance Monitor (Системный монитор) — оснастка панели управления. Позволяет мониторить счетчики производительности, журналировать и просматривать историю замеров.
Обновление статистики с помощью “плана обслуживания”:
- запускаем SSMS;
- подключаемся к нужному серверу;
- разворачиваем в Object Inspector дерево: Management Maintenance Plans (Планы обслуживания)
- правой кнопкой на узле, выбираем “Maintenance Plan Wizard”
- в визарде мышкой отмечаем нужные нам задачи:
- rebuild index (перестроить индекс)
- update statistics (обновить статистику)
- Обновление статистики — неблокирующая операция. Можно выполнять в рабочем режиме. Дополнительную нагрузку конечно создаст, но ведь у вас и так всё тормозит, будет чуть больше — незаметно.
- Перестроение индекса — блокирующая операция. Запускать только в нерабочее время. Есть исключение — Enterprise редакция сервера допускает выполнение “онлайнового ребилда”. Эта опция включается галочкой в настройках задачи. Обратите внимание, галочка есть во всех редакциях, но работает только в Enterprise.
- Конечно, эти задачи необходимо выполнять регулярно. Предлагаю простой способ определения, как часто это делать:
- при первых проблемах выполняете план обслуживания;
- если помогло — ждете пока не начнутся проблемы снова (как правило, до очередного закрытия месяца/расчета зп/ и т.п. массовых операций);
- получившийся срок нормальной работы и будет вам ориентиром;
- например, настройте выполнение плана обслуживания в два раза чаще.
Сервер работает медленно — что делать?
Используемые сервером ресурсы
Как и любой другой программе, серверу нужны: время процессора, данные на диске, объемы оперативной памяти и пропускная способность сети.
Оценить нехватку того либо иного ресурса в первом приближении можно с помощью Task Manager (Диспетчер задач), как бы по кэпски это не звучало.
Загрузка ЦП
Посмотреть загрузку в диспетчере сможет даже школьник. Здесь нам надо просто убедиться, что если процессор загружен, то именно процессом sqlserver.exe.
Если это ваш случай, то надо переходить к анализу активности пользователей, чтобы понять, что именно стало причиной загрузки (листаем ниже).
Загрузка диска
Многие смотрят только загрузку процессора, но не надо забывать что СУБД — это хранилище данных. Объемы данных растут, производительность процессоров растет, а скорость HDD практически не меняется. С SSD ситуация получше, но терабайты на них хранить затратно.
Получается так, что я чаще сталкиваюсь с ситуациями, когда узким местом становится именно дисковая система, а не ЦПУ.