
Use Safari’s web developer tools to study problematic websites
Updated on September 30, 2022
What to Know
- Activate Web Inspector on iOS: Go to Settings > Safari > Advanced and move the Web Inspector toggle switch to the On position.
- Use Web Inspector on macOS: Connect your iOS device to a Mac and choose the URL to inspect from the Develop menu.
If you run into a bug or another issue with a website on Safari mobile, use the Web Inspector tool to investigate. This article explains how to use the Safari console for iPhone to debug errors with the help of your Mac computer. Instructions apply to iPhones with iOS 14, iOS 12, or iOS 11, and well as Macs with macOS Big Sur (11.0), macOS Catalina (10.15), or macOS Mojave (10.14).
Activate Web Inspector on Your iPhone or Other iOS Device
The Web Inspector is disabled by default since most iPhone users have no use for it. However, if you’re a developer or you’re curious, you can activate it in a few short steps. Here’s how:
-
Open the iPhone Settings menu.
On an iPhone with an early version of iOS, access the Debug Console through Settings > Safari > Developer > Debug Console. When Safari on the iPhone detects CSS, HTML, and JavaScript errors, details of each display in the debugger.
-
Scroll down and tap Safari to open the screen that contains everything related to the Safari web browser on your iPhone, iPad, or iPod touch.
-
Scroll to the bottom of the page and select Advanced.
-
Move the Web Inspector toggle switch to the On position.
Connect Your iOS Device to Safari on a Mac
To use the Web Inspector, connect your iPhone or another iOS device to a Mac that has the Safari web browser and enable the Develop menu.
-
With Safari open, select Safari from the menu bar and choose Preferences.
-
Select the Advanced tab.
-
Select the Show Develop menu in menu bar check box and close the settings window.
-
From the Safari menu bar, select Develop and choose the name of your attached iOS device, then select the URL that appears under Safari to open the debug console for that site.
After you connect your device, use your Mac to inspect the website you want to debug and have it open in the Safari mobile browser.
What Is Web Inspector?
Web developers use Web Inspector to modify, debug, and optimize websites on Macs and iOS devices. With Web Inspector open, developers can inspect the resources on a web page. The Web Inspector window contains editable HTML and notes regarding the styles and layers of the web page in a separate panel.
Before iOS 6, the iPhone Safari web browser had a built-in Debug Console that developers used to find web page defects. Recent versions of iOS use Web Inspector instead.
With Safari 9 and OS X Mavericks (10.9), Apple introduced Responsive Design Mode in Web Inspector. Developers use this built-in simulator to preview how web pages scale to different screen sizes, resolutions, and orientations.
FAQ
-
How do I use Web Inspector on my iPad?
To set up Web Inspector on your iPad, open your iPad’s Settings and select Safari > Advanced, then turn Web Inspector On. Connect the iPad to a Mac computer, then open Safari on the Mac and select Safari > Preferences > Advanced, then turn on Show Develop menu in menu bar.
-
Can I use Web Inspector on iOS with Windows Chrome?
You cannot just connect your iPhone to a Windows PC and start using Web Inspector through Chrome like you can with a Mac. Installing package manager software can provide you a sort of workaround, but it’s not recommended unless you’re familiar with the package management app you intend to use.
Thanks for letting us know!
Get the Latest Tech News Delivered Every Day
Subscribe
This tip explains how to use a web browsers to help diagnose issues with published objects and/or panoramas.
Download Video
Contents
- 1 Accessing the Error Console
- 1.1 Safari
- 1.1.1 Mac OS X
- 1.1.2 Windows
- 1.2 Firefox
- 1.2.1 Mac OS X
- 1.2.2 Windows
- 1.3 Chrome
- 1.3.1 Mac OS X
- 1.3.2 Windows
- 1.4 Internet Explorer
- 1.1 Safari
- 2 Using the Error Console
- 3 See also
Accessing the Error Console
Most web browsers have a built-in error console or developer tools which may need to be activated before use. Below lists some of the more popular browsers and how to access the tools.
Safari
To access the error console in Safari, the Developer Mode must be activated first.
Mac OS X
- Open Safari and choose Safari > Preferences > Advanced. Then select Show Develop menu in menu bar.
- Choose Develop > Show Error Console.
- Close the console by clicking the close button on the left hand side of the error consoles menu bar.
Windows
- Open Safari and click Settings (highlighted below) > Preferences… > Advanced. Then select Show Develop menu in menu bar..

- To show the menu bar, click Settings > Show Menu Bar. The menu bar can be removed at any point by clicking Settings > Hide Menu Bar.
- To use the console, open Safari and in the menu bar choose Develop > Show Error Console.
- Close the console by clicking the close button on the right hand side of the error consoles menu bar.

Firefox
Firefox comes with its own built-in web console.
Mac OS X
- Open Firefox and choose Tools > Web Developer > Web Console.
- Refresh the web page.
- Close the console by clicking the Close button on the left hand side of the error consoles menu bar.
Windows
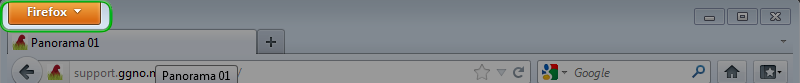
- Open Firefox then click on the Firefox drop-down menu.

- Choose Web Developer > Web Console.
- To close the Console click the Close button found on the right hand side of the Consoles menu bar.
◊ TIP: There is a powerful add-on for Firefox called Firebug, this enhances the console and makes finding faults easier. In the video above, in the second error example which used a back slash, Firebug actually shows the back slash as well as displaying the URL encoding of it.
Chrome
Google Chrome calls its error console, Developer Tools.
Mac OS X
There are a few ways to access the Developer Tools.
- From the menu bar choose View > Developer > Developer Tools. Make sure Console is highlighted then refresh the webpage.

- Open Chrome then click Customize > Tools > Developer Tools. (To close the Developer Tools click the Close button found on the left hand side of the Developer Tools menu.)

Windows
- Open Google Chrome and choose Customize > Tools > Developer Tools.
- To close the Developer Tools click the Close button found on the right hand side of the Developer Tools menu.
Internet Explorer
Internet Explorer calls their error console, Developer Tools. Unlike the other web browsers, Internet Explorer cannot detect what is happening in the Flash player so you will not get any errors. It is recommended that you use one of the other browsers for error hunting. However, it is still useful for other diagnostic reasons.
- Click Tools > F12 developer tools. The Tools button is located the right of the address bar.

- To close the developer tools click the Close button on the right in the developer tools menu.

Using the Error Console
To show the consoles working here are three links each with an error.
- Error_1 does not have its javascript file (swfobject.js) uploaded to the server, so the SWF cannot be displayed.
- Error_2 has a subfolder called, pano, that contains the SWF. The file path is using a backslash instead of a forward slash.
- Error_3 has a simple capitalization error.
Error_1 opened with Safari on Mac
When the Error Console is first opened, make sure Console and All are selected in the console’s menu bar. It is also recommended to refresh the page.
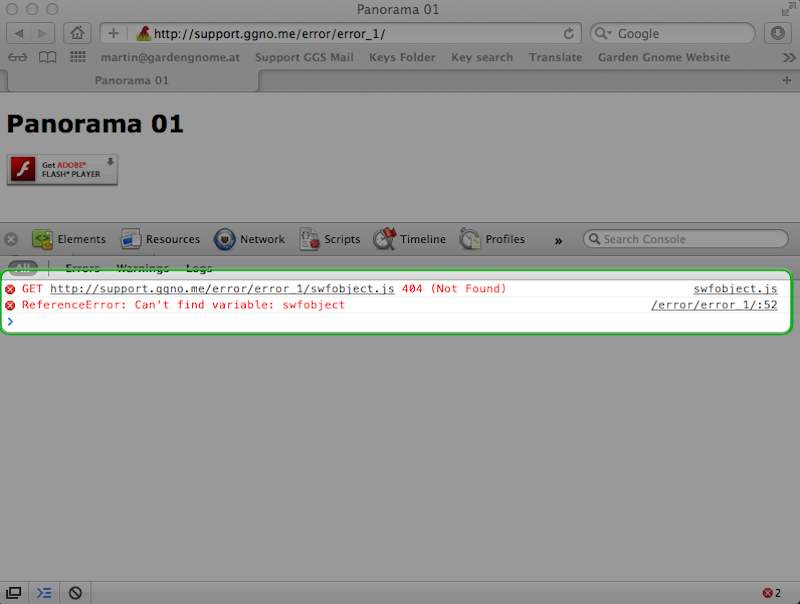
This looks as if Adobe Flash is not installed, but the console is showing it can not find the file, swfobject.js on the server.
Error_2 opened with Firefox on the PC
The page will open without an error, so click the hotspot and the console will show the error as it tries to open the next panorama.
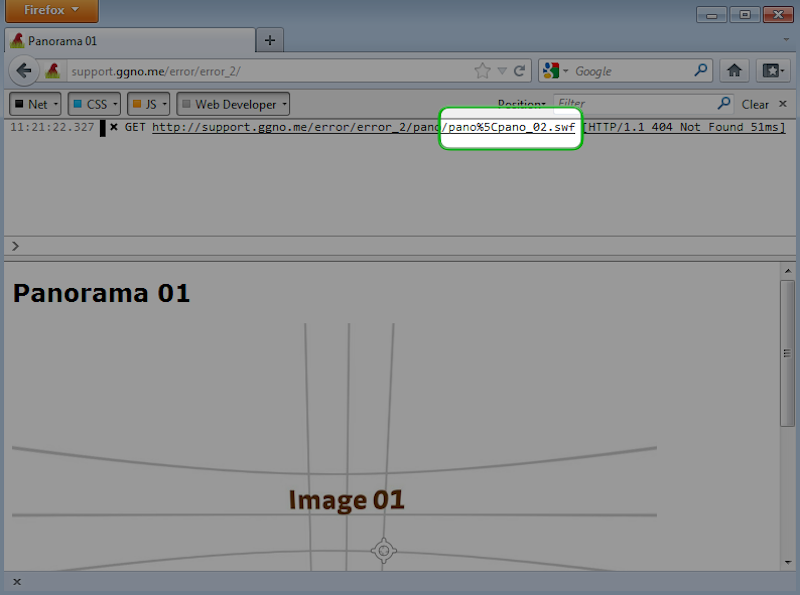
The above image is showing that rather than a forward slash (/) between the file names, it has %5C which is the URL encoding for a backslash (). So, in the Hotspot Editor the wrong slash was used.
Error_3 opened with Google Chrome on the Mac
This panorama worked before uploading to the server.
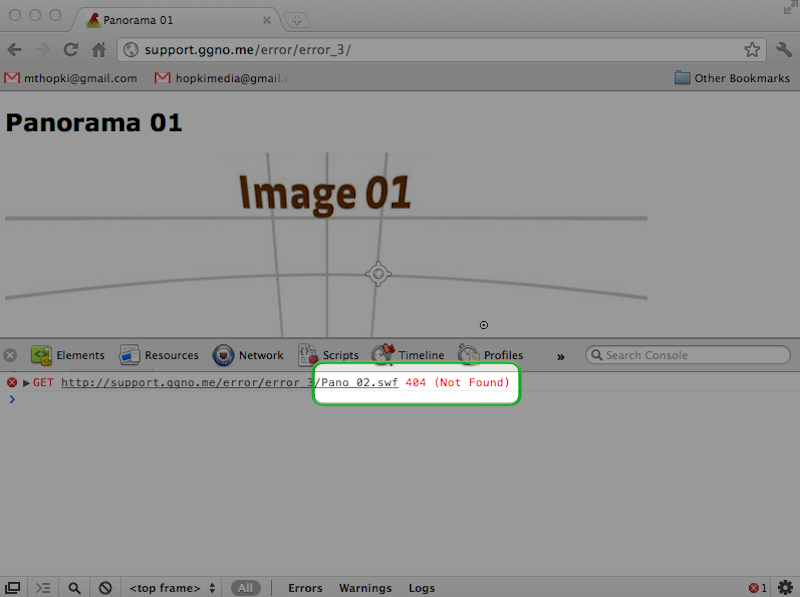
The above image is showing that when the point hotspot was clicked the panoramas did not change and an error was displayed. When clicked, the point hotspot wass looking for Pano_02.swf. However, on the server the file is pano_02.swf. When tested locally hotspots are not case sensitive, even running through the web server, but once uploaded they are.
See also
Safari Developer Tools
Google Chrome Developer Tools: Console
Firefox Error Console
w:Url_encoding
На чтение 8 мин Просмотров 1.2к. Опубликовано 01.02.2022
Содержание
- Для чего нужна консоль в браузере
- Что можно делать через консоль разработчика
- Как вызвать консоль
- Google Chrome
- На телефоне
- Safari
- Как открыть консоль разработчика в «Яндексе»
- Как открыть Консоль в Google Microsoft Edge
- Как открыть консоль в Mozilla Firefox
- Выявление основных ошибок
Для чего нужна консоль в браузере

Всего есть три причины для создания консоли в браузере:
- Для отладки самого браузера еще на стадии проектирования.
- Для обучения молодых специалистов функциям того или иного браузера.
- Для отладки профессионалами своих интернет-страниц в реальном времени.
Немногие знают, но свой сайт можно написать, используя всего 2 вещи: знания и блокнот. Однако, такой способ чреват чрезвычайно тратой собственного времени, потому что вам придется пересохранять документ после каждого изменения каких-либо параметров. На помощь приходит специальная консоль отладки – это некое поле браузера, в котором содержится абсолютно вся информация о страничке и ее исходный код. Исследуя его, можно найти много чего интересного, в том числе и ошибки разработчиков. Чтобы не совершать ошибки, используют консоль браузера.
Допустим, что вы создали интернет-страничку, но вам необходимо подогнать картинку под необходимые размеры, на выход приходит в консоль, в которой есть возможность отладки странички в реальном времени, что очень сильно экономит время и силы. В следующей части статьи мы расскажем, как в браузере «Яндекс» открыть консоль. Данные знания обязательно помогут вам, если вы начинающий веб-мастер.
Что можно делать через консоль разработчика
Если говорить в общем и целом, то консоль нужна для написания специальных кодов для различных программ.
- Консоль разработчика в браузере Google Chrome помогает отследить ошибки, которые были допущены при написании какого-либо кода.
- Помимо этого, с помощью консоли разработчика для Гугл Хром возможно выполнять некоторые команды, проверять значения переменных и так далее.
По сути, данная консоль нужна лишь программистам, поэтому, не будем углубляться в тему программирования.
Как вызвать консоль
Переходим к основной части сегодняшней инструкции. Вы уже знаете, что можно делать через консоль разработчика. Теперь, осталось лишь разобраться, как вызвать консоль разработчика в браузере Google Chrome на определенном устройстве. Немного ниже будут рассмотрены несколько способов на основных видах устройств.
Google Chrome
Откройте страницу bug.html.
В её JavaScript-коде закралась ошибка. Она не видна обычному посетителю, поэтому давайте найдём её при помощи инструментов разработки.
Нажмите F12 или, если вы используете Mac, Cmd+Opt+J.
По умолчанию в инструментах разработчика откроется вкладка Console (консоль).
Она выглядит приблизительно следующим образом:

Точный внешний вид инструментов разработки зависит от используемой версии Chrome. Время от времени некоторые детали изменяются, но в целом внешний вид остаётся примерно похожим на предыдущие версии.
- В консоли мы можем увидеть сообщение об ошибке, отрисованное красным цветом. В нашем случае скрипт содержит неизвестную команду «lalala».
- Справа присутствует ссылка на исходный код bug.html:12 с номером строки кода, в которой эта ошибка и произошла.
Под сообщением об ошибке находится синий символ >. Он обозначает командную строку, в ней мы можем редактировать и запускать JavaScript-команды. Для их запуска нажмите Enter.
Обычно при нажатии Enter введённая строка кода сразу выполняется.
Чтобы перенести строку, нажмите Shift+Enter. Так можно вводить более длинный JS-код.
Теперь мы явно видим ошибки, для начала этого вполне достаточно. Мы ещё вернёмся к инструментам разработчика позже и более подробно рассмотрим отладку кода в главе Отладка в браузере Chrome.
На телефоне
К сожалению, на смартфоне нельзя вызвать консоль разработчика в браузере Google Chrome. Причем, не получится это сделать и на iPhone, и на устройстве с операционной системой Android.
После прочтения сегодняшней инструкции, вы теперь знаете, что можно делать через консоль разработчика для браузера Google Chrome. Помимо этого, вы узнали несколько способов, которые помогут вам вызвать консоль разработчика в Гугл Хром. Если вы будете делать все действия согласно инструкциям выше, то никаких проблем у вас возникнуть не должно.
Safari
Safari (браузер для Mac, не поддерживается в системах Windows/Linux) всё же имеет небольшое отличие. Для начала работы нам нужно включить «Меню разработки» («Developer menu»).
Откройте Настройки (Preferences) и перейдите к панели «Продвинутые» (Advanced). В самом низу вы найдёте чекбокс:

Теперь консоль можно активировать нажатием клавиш Cmd+Opt+C. Также обратите внимание на новый элемент меню «Разработка» («Develop»). В нем содержится большое количество команд и настроек.
Как открыть консоль разработчика в «Яндексе»
Для открытий консоли потребуется специальное сочетание клавиш. Если почитать документацию к абсолютно любому браузеру, то можно обнаружить, что пользоваться мышкой даже не обязательно. Существует невероятное количество сочетаний клавиш, способных исполнить любое ваше желание.

Инструкция о том, как в браузере «Яндекс» открыть консоль:
- Запустите браузер от «Яндекса», после чего дождитесь его полной загрузки в оперативную память, это займет всего лишь несколько секунд.
- Теперь откройте любую интернет-страничку, например, Google, но это совсем неважно, подойдет любая.
- Для открытия инструментов «Яндекс» нажмите следующие клавиши: «Ctrl + Shift + I»
- Если вы хотите работать именно с JavaScript – это такой язык программирования, то необходимо будет зажать следующие клавиши: «Ctrl + Shift + J»
Однако, в разных браузерах отличаются способы открытия консоли, поэтому в следующем пункте мы пройдем по самым популярным браузерам.
Как открыть Консоль в Google Microsoft Edge
Как и в любом другом браузере, Microsoft Edge также имеет инструмент Console, предназначенный для разработчиков, выполняющих интерактивную отладку или специальное тестирование.
Этот инструмент регистрирует информация, связанная с посещаемой веб-страницей. Вы найдете информацию, связанную с Javascript, сетевыми запросами и ошибками безопасности.
Самый простой способ открыть Console Tool в Microsoft Edge — использовать предопределенный ярлык ( F12 Key ).
Но вы также можете сделать это через меню графического интерфейса, нажав кнопку действия (верхний левый угол)> Дополнительные инструменты> Инструменты разработчика .
Как и в других браузерах, Microsoft Edge также позволяет вам проверять определенные элементы с помощью встроенной консоли. Для этого просто выберите и щелкните элемент правой кнопкой мыши и выберите Проверить элемент.

Вот список с некоторыми полезными ярлыками, которые вы можно использовать внутри встроенной консоли Microsoft Edge:
| Запуск консоли в режиме фокуса | Ctrl + Shift + |
| Переключение на консоль | Ctrl + |
| Показать или скрыть консоль на другой вкладке DevTools | Ctrl + ` (обратная галочка) |
| Выполнить (однострочная команда) | Enter |
| Разрыв строки без выполнения (multi-lin e) | Shift + Enter или Ctrl + Введите |
| Очистить консоль от всех сообщений | Ctrl + L |
| Фильтровать журналы (установить фокус на поле поиска) | Ctrl + |
| Принять предложение автозаполнения (когда в фокусе) | Введите или |
| Предыдущее/следующее предложение автозаполнения | Клавиша со стрелкой вверх / Клавиша со стрелкой вниз |
Как открыть консоль в Mozilla Firefox
Встроенная консоль в Mozilla Firefox работает немного иначе, чем другие аналоги, которые мы проанализировали до сих пор. Я имею в виду, что он автоматически откроется в отдельном окне, а не разделит экран вашего браузера пополам.
Это обеспечивает более продуктивный подход для людей, у которых есть второй экран, но они могут попасть внутрь способ пользователей, которым нужно работать с одним маленьким экраном. (Если вы находитесь в этом сценарии, вы можете использовать сочетание клавиш Alt + Tab для переключения между Firefox и связанной консолью браузера.
Чтобы открыть встроенную консоль браузера в Mozilla Firefox , у вас есть три варианта:
- Вы можете использовать универсальный ярлык — Ctrl + Shift + J (или Cmd + Shift + J на Mac)
- Вы можете открыть его из меню действий — щелкнув меню действий> Web Developer> Browser Console .

- Или вы можете принудительно открыть консоль браузера напрямую, запустив Firefox из командной строки и передав аргумент ‘-jsconsole’: /Applications/FirefoxAurora. app/Contents/MacOS/firefox-bin -jsconsole
Примечание. Firefox также включает веб-консоль, которая очень похожа на в консоль браузера, но он применяется к отдельной вкладке контента, а не ко всему браузеру.
Выявление основных ошибок
При возникновении возможных ошибок мы сразу будем об этом уведомлены во вкладке Console – в ней отобразится информация с красной строкой текста. Рассмотрим самые распространенные ошибки, которые могут возникать в Google Chrome, Safari и Internet Explorer:
- Uncaught TypeError: Cannot read property. Ошибка возникает в Хроме при вызове метода или чтении свойства для неопределенного объекта.
- TypeError: ‘undefined’ is not an object (evaluating). Аналогична предыдущей ошибке, но только в Safari.
- TypeError: null is not an object (evaluating). Возникает в Сафари при вызове метода или чтении свойства для нулевого объекта.
- (unknown): Scripterror. Обозначает ошибку скрипта.
- TypeError: Object doesn’t support property. Встречается в Internet Explorer – возникает при вызове определенного метода.
- TypeError: ‘undefined’ is not a function. Указывает на неопределенную функцию (в Chrome).
- Uncaught RangeError: Maximum call stack. Ошибка в Chrome, означающая превышение максимального размера стека.
- TypeError: Cannot read property ‘length’. Невозможно прочитать свойство.
- Uncaught TypeError: Cannot set property. Возникает, когда скрипт не может получить доступ к неопределенной переменной.
- ReferenceError: event is not defined. Обозначает невозможность получения доступа к переменной, не входящей в текущую область.
Устранение основных и прочих ошибок может быть проблематично. Если вы считаете, что они сильно мешают производительности вашего сайта, то рекомендуем поискать информацию о них в официальной документации браузера либо на тематических форумах.
Источники
- https://FB.ru/article/373559/kak-otkryit-konsol-v-brauzere-yandeks-i-drugih-brauzerah
- https://chromefaq.ru/nastrojki/kak-otkryt-konsol-v-google-chrome
- https://learn.javascript.ru/devtools
- https://techscreen.ru/firefox/kak-otkryt-konsol-brauzera-v-chrome-safari-firefox-i-edge/
- https://timeweb.com/ru/community/articles/kak-ispolzovat-konsol-brauzera-dlya-vyyavleniya-oshibok
Is there any way to log to Safari’s JavaScript console when running with the built-in JavaScript debugger? I’ve read the Firefox JavaScript logging question and hoping that there is a simple («native») way to do it in WebKit/Safari.
Thanks
![]()
asked Sep 20, 2010 at 5:00
![]()
2
Make sure you have «All» selected in the top right corner of the dev tools.

If it’s set to «Error» then your Safari will only show console.error().
answered Mar 17, 2017 at 16:09
![]()
Boris VerkhovskiyBoris Verkhovskiy
14.2k10 gold badges100 silver badges101 bronze badges
2
It works just the same in Safari as it does in Chrome and Firefox. By default the developer tools is not turned on, so make sure you go to Preferences -> Advanced -> Show Develop Menu in Menu Bar. Then you can pull up the console with Command+Option+C. (That shortcut obviously assumes Mac, not sure the PC shortcut, but it’s in the dropdown as well)
answered Sep 20, 2010 at 5:19
![]()
RobertRobert
21.1k9 gold badges54 silver badges65 bronze badges
2
You can use the same console object described in that question. The messages will show up in the console tab.
console.log("hello console");
console.log will work «natively» in Firefox (with Firebug), IE8+, and WebKit browsers (including Safari).
answered Sep 20, 2010 at 5:21
![]()
Cristian SanchezCristian Sanchez
30.9k11 gold badges56 silver badges63 bronze badges
0
Problems with page editing, broken interface elements, misbehaving blocks, and interactive functionality may be due to JavaScript errors or conflicts. Checking the browser console for errors is the first step in troubleshooting these issues.
After opening the browser console, you can start looking for errors. Errors will be displayed differently in each browser, but generally will be color coded, labelled, or marked with an identifying icon. If you find an error, make sure to copy the error name, location, and line number.
Example errors:
The error is on the left, followed by the location, and then the line number.
Uncaught SyntaxError: Unexpected token var product-list:355
Uncaught ReferenceError: $ is not defined test-block:1967
Uncaught TypeError: Cannot call method 'setValue' of undefined list.js:249
Uncaught ReferenceError: jQuery is not defined dropdown.js:1
Uncaught SyntaxError: Unexpected token ( view.js:45
Chrome
keyboard shortcut:
— Ctrl + Shift + J (Windows/Linux)
— Command + Option + J (Mac)
menu location: Menu > More Tools > Developer Tools > Console tab
https://developers.google.com/web/tools/chrome-devtools/debug/console/console-ui?hl=en
Firefox
Browser Console
keyboard shortcut:
— Ctrl + Shift + J (Windows/Linux)
— Command + Shift + J (Mac)
menu location: Menu > Developer > Browser Console
https://developer.mozilla.org/en-US/docs/Tools/Browser_Console
Web Console
keyboard shortcut:
— Ctrl + Shift + K (Windows/Linux)
— Command + Option + K (Mac)
menu location: Menu > Developer > Web Console
https://developer.mozilla.org/en-US/docs/Tools/Web_Console/Opening_the_Web_Console
The Firefox browser console and web console can both be used to view errors. The difference is the web console offers a command line for entering JavaScript.
IE8, IE9, IE10, IE11, Edge
keyboard shortcut: F12
IE8
menu location: Tools > Developer Tools > Script tab > Console tab
https://msdn.microsoft.com/en-us/library/dd565625(v=vs.85).aspx
IE9, IE10, IE11
menu location: Menu cog icon > F12 Developer Tools > Console tab
https://msdn.microsoft.com/en-us/library/bg182326(v=vs.85).aspx
Edge
menu location: Menu «three dots» icon > F12 Developer Tools > Console tab
https://dev.windows.com/en-us/microsoft-edge/platform/documentation/f12-devtools-guide/
Opera
keyboard shortcut:
— Ctrl + Shift + J (Windows/Linux)
— Command + Option + J (Mac)
menu location:
The Opera developer tools must be enabled before use.
1. Menu > More tools > enable «Show developer menu»
2. Menu > Developer > Developer Tools
https://developers.google.com/web/tools/chrome-devtools/debug/console/console-ui?hl=en
Safari
keyboard shortcut: Command + Option + C
menu location:
The Safari developer tools must be enabled before use.
1. Safari > Preferences > Advanced > enable «Show Develop menu in menu bar»
2. Develop > Show Error Console
https://developer.apple.com/library/safari/documentation/AppleApplications/Conceptual/Safari_Developer_Guide/GettingStarted/GettingStarted.html#//apple_ref/doc/uid/TP40007874-CH2-SW1