
Setting up a monitoring tool for NGINX is an important part of maintaining website operations. Proper NGINX monitoring can reveal a lot of useful information about the underlying application performance. There are quite a few monitoring systems out there suitable for the task; the first step, however, is to enable metric collection in NGINX.
Using the stub_status Module
There’s a module for NGINX Open Source called ngx_http_stub_status_module (or simply stub_status) that exposes a few important metrics about NGINX activity.
To check if your NGINX build has the stub_status module, run nginx -V:
$ nginx -V 2>&1 | grep --color -- --with-http_stub_status_moduleAll of our NGINX builds include the stub_status module on all supported platforms.
If your NGINX build does not include the stub_status module, you have to rebuild from source and include the --with-http_stub_status_module parameter to the configure script.
As the next step, enable the module in your NGINX configuration by including the stub_status directive in a location block. You can always add the block to an existing server configuration. Alternatively, add a separate server block, with a single specialized location for the stub_status directive, as here:
server {
    listen 127.0.0.1:80;
    server_name 127.0.0.1;

    location /nginx_status {
        stub_status;
    }
}
Appropriate server blocks for the stub_status directive are sometimes found outside of the main configuration file (nginx.conf). If you don’t see a suitable block in that file, search for additional configuration files which are typically included in nginx.conf.
We also recommend that you allow only authorized users to access the metrics, for example by including the allow and deny directives in the location or server block.
After the stub_status module is configured, don’t forget to reload the NGINX configuration (with the service nginx reload command, for example). You can read more about NGINX control signals here.
To display the stub_status metrics, make a curl query. The following is appropriate for the configuration shown above:
$ curl http://127.0.0.1/nginx_status
Active connections: 2
server accepts handled requests
 841845 841845 1631067
Reading: 0 Writing: 1 Waiting: 1
If this doesn’t work, check where the requests to /nginx_status are routed. In many cases, another server block can be the reason why you can’t access the stub_status metrics. To read more about these instance‑wide NGINX metrics, see the reference documentation .
With the stub_status module enabled in NGINX and working, you can proceed with the installation and configuration of your monitoring system of choice.
Log Files and syslog
The NGINX access log and error log contain a lot of useful information suitable for metric collection. You can use NGINX variables to fully customize the access log format. Certain monitoring tools can leverage NGINX log files for metric collection.
To meet various performance and security requirements, consider using the NGINX syslog capability. While log files are written to disk, syslog allows NGINX to send log data over a network protocol. For example, you can set up a dedicated Linux system to collect all of your log data from various NGINX instances.
For more information on logging, please refer to the NGINX Plus Admin Guide.
Monitoring NGINX with Amplify
We have a native tool for NGINX monitoring. It’s called NGINX Amplify, and it’s a SaaS tool that you can use to monitor up to five servers for free (subscriptions are available for larger numbers of servers).
It’s easy to get started with NGINX Amplify. You can get out-of-the-box graphs for all key NGINX metrics in under ten minutes. NGINX Amplify automatically uses metrics from stub_status and from access logs, and can collect various OS information as well.
Using NGINX Amplify, you can visualize your NGINX performance, and monitor the OS, PHP‑FPM, Docker containers, and more. A unique feature in Amplify is a static analyzer for your NGINX configuration that provides recommendations for making the configuration more secure and efficient.
Read more about NGINX Amplify here, and try it out for free.
Additional API Module in NGINX Plus
NGINX Plus provides a better way to obtain performance metrics via a specialized API module.
The API module offers a detailed set of metrics, with the primary focus on load balancing and virtual server stats. As an example, a breakdown of all HTTP status codes (1xx, 2xx, 3xx, 4xx, 5xx) is presented for server blocks. Health status information is available for both HTTP and TCP/UDP upstream servers. Cache metrics include hits and misses for each cache zone.
Aside from gathering an extended set of metrics, the API also enables you to reconfigure HTTP and TCP/UDP upstream server groups and manage key‑value variables without reloading configuration or restarting NGINX Plus.
NGINX Plus also comes with an integrated dashboard that utilizes the additional metrics. The additional metrics are also available for use in NGINX Amplify.
Other Monitoring Solutions
A number of other monitoring products can collect and present NGINX metrics. The links below describe most common integration scenarios:
- The NGINX monitoring extension for AppDynamics
- Datadog‑NGINX integration
- NGINX monitoring with Dynatrace
- The NGINX plug‑in for New Relic
- The NGINX plug‑in for Pingdom Server Monitor
- Prometheus HTTP exporters and integrations

Managing Kubernetes Traffic with F5 NGINX: A Practical Guide
Learn how to manage Kubernetes traffic with F5 NGINX Ingress Controller and F5 NGINX Service Mesh and solve the complex challenges of running Kubernetes in production.
Едва ли сегодня найдется системный администратор, который не слышал про NGINX — программу, способную выполнять очень много функций, от кэширования и отдачи статического контента сайта до балансировки нагрузки и построения узлов CDN.
Правильная настройка NGINX влияет на работоспособность и производительность использующих его сайтов.
Из нашей статьи вы узнаете, как установить NGINX в ОС Debian и настроить мониторинг этой программы с помощью SAAS-сервиса NGINX Amplify, а также с помощью Zabbix.
Установка NGINX
Если на вашем сервере есть панель, такая как ISPmanager или Hestia Control Panel, то, скорее всего, NGINX уже установлен. Вы можете проверить это такой командой:
# systemctl status nginxЕсли NGINX отсутствует, то вы увидите сообщение:
Unit nginx.service could not be found.При наличии на сервере упомянутых выше панелей следует устанавливать NGINX только через них. Если же панелей нет, то установите NGINX, как описано в документации.
Далее мы привели краткую инструкцию по установке, опустив проверку ключа:
# apt install curl gnupg2 ca-certificates lbs.-release debian-archive-keyring
# curl https://nginx.org/keys/nginx_signing.key | gpg --dearmor
    | sudo tee /usr/share/keyrings/nginx-archive-keyring.gpg >/dev/null

# echo "deb [signed-by=/usr/share/keyrings/nginx-archive-keyring.gpg]
http://nginx.org/packages/debian `lsb_release -cs` nginx"
    | sudo tee /etc/apt/sources.list.d/nginx.list

# apt update
# apt install nginx
Для запуска NGINX используйте команду systemctl:
# systemctl start nginx
# systemctl enable nginx
Проверить состояние NGINX можно с помощью той же команды, что и при проверке на наличие программы в панели:
# systemctl status nginxЕсли все хорошо, то сервис nginx будет в состоянии active (running) и enabled:
● nginx.service - nginx - high performance web server
     Loaded: loaded (/lib/systemd/system/nginx.service; enabled; vendor preset: enabled)
     Active: active (running) since Mon 2022-09-26 15:33:34 MSK; 2s ago
       Docs: https://nginx.org/en/docs/
    Process: 1951723 ExecStart=/usr/sbin/nginx -c /etc/nginx/nginx.conf (code=exited, status=0/SUCCESS)
   Main PID: 1951724 (nginx)
      Tasks: 5 (limit: 4676)
     Memory: 3.9M
        CPU: 20ms
     CGroup: /system.slice/nginx.service
             ├─1951724 nginx: master process /usr/sbin/nginx -c /etc/nginx/nginx.conf
             ├─1951725 nginx: worker process
             ├─1951726 nginx: worker process
             ├─1951727 nginx: worker process
             └─1951728 nginx: worker process
Здесь видно, что файл конфигурации NGINX /etc/nginx/nginx.conf передается программе /usr/sbin/nginx при запуске сервиса.
Если сервис запущен, то работает один мастер-процесс, а также несколько рабочих процессов (в нашем случае их четыре). Количеством рабочих процессов можно управлять, редактируя файл конфигурации с последующим перезапуском сервиса nginx.
Файлы конфигурации NGINX
Файлы конфигурации NGINX находятся в каталоге /etc/nginx и его подкаталогах. Основной файл конфигурации etc/nginx/nginx.conf подключает файлы конфигурации, расположенные в подкаталогах каталога /etc/nginx. Состав этих подкаталогов может изменяться, если на сервере установлена панель управления, например, ISPmanager.
Когда мы будем подключать мониторинг NGINX, а также оптимизировать эту программу для повышения производительности, нам потребуется редактировать файлы конфигурации.
В каталоге /etc/nginx есть ряд файлов и каталогов:
# ls -1 /etc/nginx
conf.d
fastcgi.conf
fastcgi_params
koi-utf
koi-win
mime.types
modules
modules-enabled
nginx.conf
proxy_params
scgi_params
sites-available
sites-enabled
snippets
uwsgi_params
win-utf
В каталоге conf.d находятся файлы конфигурации, которые включаются в основной файл nginx.conf с помощью оператора include:
include /etc/nginx/conf.d/*.conf;Этот оператор добавляет все файлы с расширением имени conf к основному файлу конфигурации.
Каталог sites-available содержит файлы конфигурации для виртуальных хостов, а каталог sites-enabled — ссылки на эти файлы конфигурации для активных хостов.
Если на сервере установлена панель ISPmanager, к перечисленному выше каталогу добавляются еще несколько:
vhosts
vhosts-includes
vhosts-resources
Они подключаются к основному файлу конфигурации nginx:
include /etc/nginx/vhosts/*/*.conf;В каталоге vhosts содержатся файлы конфигурации сайтов, принадлежащих пользователям. Что же касается каталога vhosts-includes, то там находятся дополнительные файлы конфигурации, которые панель ISPmanager записывает при установке таких сайтов и систем, как phpMyAdmin, Roundcube, awstats и аналогичных:
awstats-nginx.conf
blacklist-nginx.conf
disabled.conf
letsencrypt.conf
phpmyadmin-nginx.conf
roundcube-nginx.conf
В других панелях управления сервером состав, назначение и расположение файлов конфигурации NGINX может быть иным.
Настройка сбора метрик NGINX
Чтобы контролировать работу NGINX с помощью Zabbix или SAAS-сервиса NGINX Amplify, необходимо добавить в конфигурацию NGINX следующий блок:
server {
    listen 127.0.0.1:80;
    server_name 127.0.0.1;
    location /nginx_status {
        stub_status on;
        access_log off;
        allow 127.0.0.1;
        deny all;
    }
}
Запишите эту конфигурацию в файл /etc/nginx/conf.d/stub_status.conf, а затем проверьте её, перезапустите сервис nginx и убедитесь, что он работает:
# nginx -t
# systemctl restart nginx
# systemctl status nginx
Если на сервере установлена панель ISPmanager, запишите этот файл в каталог /etc/nginx/vhosts-includes/ вместо каталога /etc/nginx/conf.d/.
Далее с помощью curl проверьте доступность сайта http://127.0.0.1/nginx_status:
$ curl http://127.0.0.1/nginx_statusЕсли все сделано правильно, вы увидите на консоли такие строки (у вас будут другие цифры):
Active connections: 185
server accepts handled requests
 3801461 3801356 11950677
Reading: 0 Writing: 16 Waiting: 171
Теперь отредактируйте формат журналов доступа и ошибок в файле /etc/nginx/nginx.conf. Сразу после установки NGINX в этом файле журнал ошибок, журнал доступа, а также формат журнала определены так:
error_log  /var/log/nginx/error.log notice;
access_log  /var/log/nginx/access.log main;
log_format  main  '$remote_addr - $remote_user [$time_local] "$request" '
  '$status $body_bytes_sent "$http_referer" '
  '"$http_user_agent" "$http_x_forwarded_for"';
Закройте символом комментария определение журнала доступа и определение пути к журналу access_log, добавив другие определения:
log_format main_ext '$remote_addr - $remote_user [$time_local] "$request" ' '$status $body_bytes_sent "$http_referer" ' '"$http_user_agent" "$http_x_forwarded_for" ' '"$host" sn="$server_name" ' 'rt=$request_time ' 'ua="$upstream_addr" us="$upstream_status" ' 'ut="$upstream_response_time" ul="$upstream_response_length" ' 'cs=$upstream_cache_status' ;

# access_log  /var/log/nginx/access.log  main;
 access_log  /var/log/nginx/access.log main_ext;
После внесения изменений проверьте конфигурацию NGINX и перезапустите сервис, как мы это делали раньше.
Мониторинг с помощью SAAS-сервиса NGINX Amplify
SAAS-сервис NGINX Amplify от создателей NGINX несложен в подключении, бесплатен при добавлении до 5 узлов и обладает большими возможностями мониторинга. Этот сервис выполняет сбор статистики при помощи собственного агента, который потребуется установить на контролируемый сервер.
Если нужно контролировать много узлов или хочется все держать в своих руках, а также если у вас уже имеются серверы Zabbix, возможно, вам больше подойдет мониторинг NGINX при помощи Zabbix, о чем мы расскажем ниже в этой статье.
Установка NGINX Amplify
Прежде чем приступить к установке агента NGINX Amplify, необходимо установить NGINX и настроить сбор метрик NGINX, как это было описано ранее в нашей статье.
Обратите внимание, что в процессе установки будет добавлен файл репозитория /etc/apt/sources.list.d/nginx-amplify.list.
Если на сервере установлена панель управления, такая как ISPmanager, убедитесь, что эта операция не приведет к конфликтам. В том случае, когда разработчики панели управления сервером не гарантируют совместимость с агентом NGINX Amplify, рассмотрите возможность использования для мониторинга NGINX средств Zabbix.
На момент написания этой статьи поддержка компании ISPmanager ответила, что совместимость NGINX Amplify с ISPmanager 6 не тестировалась, а добавлять сторонние репозитории не рекомендуется.
Если панели ISPmanager на сервере нет, приступим к установке. Зарегистрируйтесь на сайте https://amplify.nginx.com/. После регистрации на экране появится инструкция для установки агента NGINX Amplify на контролируемый сервер (рис. 1).

Прежде всего в этой инструкции предлагается скачать скрипт установки агента. Для Debian можно использовать команду wget:
# wget https://github.com/nginxinc/nginx-amplify-agent/raw/master/packages/install.shДалее запустите скрипт установки (часть ключа мы закрыли символами «», у вас будет свой ключ):
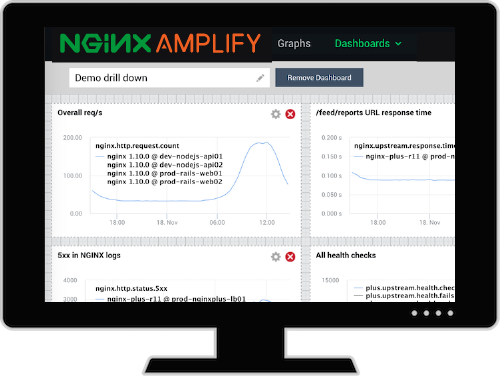
# API_KEY='485*********************6f5' sh ./install.shЕсли установка прошла успешно, то примерно через одну минуту на странице сервиса появится информация о состоянии добавленного узла (рис. 2).
")
В данном случае показаны графики для тестового узла, нагруженные при помощи сервиса https://loaddy.com/. Ошибки на графике NGINX HTTP Errors появились из-за попыток доступа сервиса к несуществующей странице.
Полная документация по установке и настройке NGINX Amplify доступна на сайте проекта.
Контролируемые метрики
SAAS-сервис NGINX Amplify анализирует значительное количество метрик, имеющих отношение к NGINX, к операционной системе, собирает метрики PHP-FRM, метаданные NGINX, а также информацию об операционной системе, такую как имя узла, время uptime и так далее.
Полный список метрик можно найти здесь.
Веб-интерфейс NGINX Amplify
С помощью веб-интерфейса NGINX Amplify, доступного зарегистрированным пользователям, удобно просматривать текущее состояние сервиса NGINX и узлов, на которых он запущен. Также можно получить сведения о конфигурации NGINX и ОС, и, что ценно, рекомендации по настройке конфигурации NGINX.
Веб-интерфейс состоит из нескольких страниц, описанных в документации.
Overview
По содержимому страницы Overview вы можете быстро определить состояние вашей системы — посмотреть общее количество запросов, ошибок с кодом 5xx, среднее время запросов, трафик, а также использование CPU.
Graphs
На странице Graphs можно просмотреть предопределенный набор графиков, отражающих состояние основных метрик, как для NGINX, так и для системы.
Dashboards
Открыв страницу Dashboards, вы сможете создать и настроить панели с графиками нужных вам метрик.
Тут можно создать новые наборы данных для графиков, новые графики и добавить в мониторинг новые значения.
Analyzer
На этой странице можно получить отчеты по конфигурации выбранной системы, а также рекомендации по настройке параметров в файле конфигурации NGINX с точки зрения повышения производительности и улучшения безопасности.
Alerts
На странице Alerts можно создать правила оповещения о событиях, требующих реакции. Извещения могут быть отправлены на электронную почту или в Slack.
Мониторинг NGINX с помощью Zabbix
С помощью шаблона Nginx by Zabbix agent можно очень просто организовать мониторинг NGINX. К сожалению, от такого мониторинга вы не получите рекомендаций по настройке конфигурации NGINX, однако упомянутый шаблон содержит необходимые метрики и триггеры. Анализируя метрики, можно оптимизировать настройки NGINX вручную.
Кроме того, мониторинг Zabbix можно использовать в тех случаях, когда SAAS-сервис NGINX Amplify не применим по тем или иным причинам.
Описание шаблона можно найти в документации.
Настройка мониторинга
Настройка мониторинга с помощью шаблона Nginx by Zabbix agent заключается в подключении этого шаблона к узлу, где работает NGINX, а также в добавлении файла конфигурации с таким содержимым:
location = /basic_status {
    stub_status;
    allow 127.0.0.1;
    allow ::1;
    deny all;
}
Вы можете записать эту конфигурацию в файл /etc/nginx/conf.d/stub_status.conf, как мы это делали при настройке NGINX для NGINX Amplify.
При использовании на сервере панели ISPmanager запишите файл stub_status.conf в каталог /etc/nginx/vhosts-includes.
После добавления файла проверьте конфигурацию, перезапустите сервис nginx и убедитесь, что он работает:
# nginx -t
# systemctl restart nginx
# systemctl status nginx
Далее с помощью curl проверьте доступность сайта по адресу http://127.0.0.1/basic_status:
$ curl http://127.0.0.1/basic_statusНа консоли должна появиться такая информация:
Active connections: 238
server accepts handled requests
 3963975 3963870 12559829
Reading: 0 Writing: 46 Waiting: 229
Макросы шаблона Nginx by Zabbix agent
Если вы сделали настройки, как это было описано в предыдущем разделе статьи, вам, скорее всего, не придется изменять макросы шаблона Nginx by Zabbix agent (рис. 3).

При необходимости вы можете изменить параметры, определяющие подключение к сайту сбора метрик NGINX — {$NGINX.STUB_STATUS.HOST}, {$NGINX.STUB_STATUS.PATH} и {$NGINX.STUB_STATUS.PORT}.
Например, если вы раньше настраивали этот сайт для NGINX Amplify, то в макросе {$NGINX.STUB_STATUS.PATH} вместо basic_status укажите nginx_status.
Параметр {$NGINX.DROP_RATE.MAX.WARN} определяет порог срабатывания триггера, сигнализирующего о потерянных соединениях, а параметр {$NGINX.RESPONSE_TIME.MAX.WARN} — максимальное время ответа для использования в триггерах.
Метрики шаблона Nginx by Zabbix agent
В шаблоне Nginx by Zabbix agent определены все метрики, необходимые для контроля работоспособности и производительности NGINX (рис. 4).

Это состояние сервиса, время его ответа, количество дочерних процессов, запущенных сервисом NGINX, память, зарезервированная для NGINX и использованная этим сервисом, использование CPU, а также параметры, имеющие отношение к соединениям, которые клиенты устанавливают с сервисом NGINX.
Полный перечень метрик вы найдете в описании агента.
Триггеры шаблона Nginx by Zabbix agent
В шаблоне Nginx by Zabbix agent определены триггеры, срабатывающие при возникновении ситуаций, требующих внимания системного администратора (рис. 5).

Самый высокий уровень важности High у триггера Nginx: Process is not running. Этот триггер срабатывает, когда сервис NGINX не активен. Возможно, он не запустился после изменения конфигурации и перезапуска из-за недостатка оперативной памяти или перестал работать по какой-то другой причине.
Средний уровень важности Average у триггера Nginx: Service is down, который устанавливается, если не запущен агент Nginx by Zabbix agent или если не работает сервис NGINX.
Остальным триггерам назначен уровень предупреждения Warning.
Срабатывание триггера Nginx: High connections drop rate говорит о том, что NGINX не успевает обрабатывать все соединения, и такая ситуация требует исследования и настройки конфигурации.
Триггер Nginx: Service response time is too high срабатывает, если время ответа NGINX больше, чем это определено в соответствующем макросе. Такая ситуация также требует проверки и оптимизации настроек конфигурации NGINX.
И, наконец, срабатывание триггера Nginx: Failed to fetch stub status page говорит о невозможности мониторинга состояния NGINX, так как сайт сбора метрик, такой как http://127.0.0.1/basic_status, не возвращает состояние NGINX. В этом случае нужно проверить настройки данного сайта.
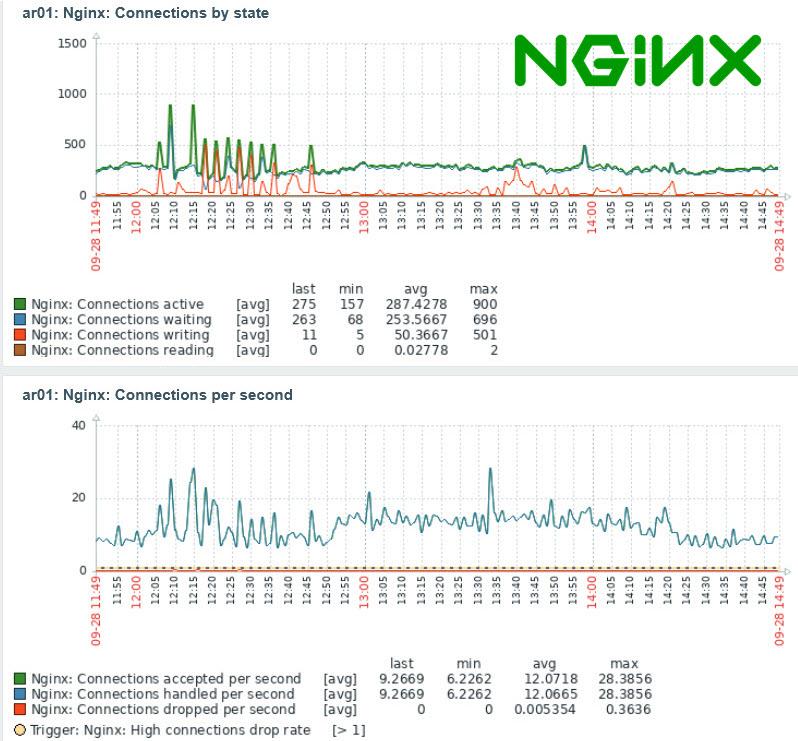
Графики в шаблоне Nginx by Zabbix agent
В шаблоне имеются четыре графика с наиболее важной информацией NGINX, которые можно добавить в панель (рис. 6).

Это графики, имеющие отношение к соединениям, интенсивности запросов и установки соединений, а также к использованию оперативной памяти. Анализируя эти графики, а также факт срабатывания триггеров Nginx: High connections drop rate и Nginx: Service response time is too high, можно сделать заключение о необходимости оптимизации настроек сервиса NGINX.
Оптимизация настроек сервиса NGINX
Оптимизируя настройки сервиса NGINX, можно в десятки раз повысить скорость работы сайтов, размещенных на сервере.
Для изменения настроек сделайте резервную копию файла /etc/nginx/nginx.conf, а затем отредактируйте его. Далее проверьте конфигурацию NGINX, перезапустите сервис и убедитесь, что он запустился:
# nginx -t
# systemctl restart nginx
# systemctl status nginx
Параметры описаны в документации. В данной статье приведены рекомендации по настройке параметров.
Также, возможно, вам будет полезна книга «The Complete NGINX Cookbook», которую можно загрузить бесплатно с сайта разработчика. Вопросы оптимизации рассмотрены там в главе 15.
Далее мы расскажем об основных настройках.
Количество рабочих процессов worker_processes
Как мы уже говорили, параметр worker_processes задает количество рабочих процессов NGINX, которые запускает мастер-процесс этого сервиса.
Вы можете задать количество процессов равное количеству ядер CPU в вашей системе, или позволить NGINX определить это количество автоматически, указав параметр auto:
worker_processes auto; Количество ядер в системе можно определить при помощи команды lscpu:
# lscpu
Architecture:                    x86_64
CPU op-mode(s):                  32-bit, 64-bit
Byte Order:                      Little Endian
Address sizes:                   46 bits physical, 48 bits virtual
CPU(s):                          40
On-line CPU(s) list:             0-39
…
Можно также использовать команду, которая покажет на консоли только количество ядер:
# grep processor /proc/cpuinfo | wc -l
40
Максимальное количество соединений worker_connections
По умолчанию NGINX допускает 512 одновременных соединений. Если умножить это значение на worker_processes, то получим максимальное количество клиентов, обслуживаемых NGINX одновременно.
Значение worker_connections рекомендуется установить равным максимальному количеству файловых дескрипторов, которое можно определить так:
# ulimit -n
1024
Ниже мы привели пример установки worker_connections:
worker_connections 1024;Журналы ошибок и доступа
Если нужно ускорить работу NGINX за счет сокращения обращений к диску, то в различных статьях рекомендуют либо совсем отключить журналы доступа и ошибок, либо добавить буферизацию журнала доступа.
Отключить журнал ошибок можно так:
#error_log  /var/log/nginx/error.log warn;
error_log /dev/null error
Иногда рекомендуется записывать в журнал только критичные ошибки:
error_log /var/log/nginx/error.log crit;Но надо сказать, что эти варианты едва ли приведут к значительной экономии ресурсов. К тому же так можно пропустить важные сообщения.
Для отключения журнала доступа используйте следующую конструкцию:
#access_log /var/log/nginx/access.log main;
access_log off;
Хороший способ сокращения количества обращений к диску за счет журнала доступа — включить его буферизацию:
access_log /var/log/nginx/access.log main buffer=32k;Подробнее о логах и буферизации можно прочитать здесь.
Если вы используете для мониторинга NGINX Amplify, то при отключении журнала доступа и журнала ошибок мониторинг не получит полную информацию о состоянии NGINX.
Сжатие контента
Чтобы уменьшить объем передаваемых данных и ускорить загрузку в браузер содержимого текстовых страниц, скриптов и других файлов, добавьте в конфигурацию NGINX (для всего сервиса или только для отдельных сайтов) следующие строки:
gzip on;
gzip_comp_level 5;
gzip_disable "msie6";
gzip_types text/plain text/css application/json application/x-javascript text/xml application/xml application/xml+rss text/javascript application/javascript;
В приведенном примере включается сжатие (компрессия) gzip, при этом уровень сжатия устанавливается равным 5 (можно указывать от 1 до 9, уровень 5 — оптимальный). Чем больше уровень сжатия, тем меньше передается данных, но тем больше тратится ресурсов процессора.
Строка «gzip_disable «msie6″» отключает сжатие для устаревшего браузера Microsoft IE 6.
С помощью оператора gzip_types вы можете перечислить типы данных, которые нужно сжимать перед отправкой клиенту.
Кэширование статического контента
Чтобы сократить трафик, можно кэшировать статический контент в браузере, добавляя заголовок Cache-control. Для этого можно использовать настройку expires:
location ~* ^.+.(jpg|jpeg|gif|png|svg|js|css|mp3|ogg|mpe?g|avi|zip|gz|bz2?|rar|swf)$ {
	expires 7d;
	try_files $uri $uri/ @fallback;
    }
Здесь данные перечисленных в location типов кэшируются браузером на 7 дней.
Подробнее об этой возможности читайте здесь.
Еще одна возможность касается кэширования контента на дисках сервера средствами NGINX. Этой теме можно было бы посвятить отдельную статью, а сейчас мы ограничимся ссылкой на соответствующий раздел документации и на статьи по этой теме:
-
https://ru.linuxcapable.com/nginx-optimization-tuning-with-caching/
-
https://itnan.ru/post.php?c=1&p=520016
-
https://habr.com/ru/post/428127/
-
https://searchengines.guru/ru/forum/879527
Подключая кэширование контента на сервере при помощи NGINX, продумайте процедуру полной или выборочной очистки кэша.
Предупреждения при тестировании конфигурации NGINX
При тестировании конфигурации командой «nginx -t» на консоль выводятся обнаруженные ошибки и предупреждения. Некоторые из них могут быть связаны с большим количеством сайтов, определенных в конфигурации NGINX.
Например, можно столкнуться с таким предупреждением:
nginx: [warn] could not build optimal server_names_hash, you should increase either server_names_hash_max_size: 512 or server_names_hash_bucket_size: 64; ignoring server_names_hash_bucket_sizeВ данном случае помогло включение в конфигурацию NGINX следующих строк:
http {
  ...
  server_names_hash_max_size 512;
  server_names_hash_bucket_size 128;
  ...
}
Это решение было найдено здесь. Также эта ситуация описана в документации.
Сообщество NGINX очень большое, поэтому, если в предупреждении или сообщении об ошибке нет конкретных рекомендаций, вы всегда сможете найти ответ при помощи поиска.
Автор статьи: Александр Фролов.
НЛО прилетело и оставило здесь промокод для читателей нашего блога:
— 15% на все тарифы VDS (кроме тарифа Прогрев) — HABRFIRSTVDS.
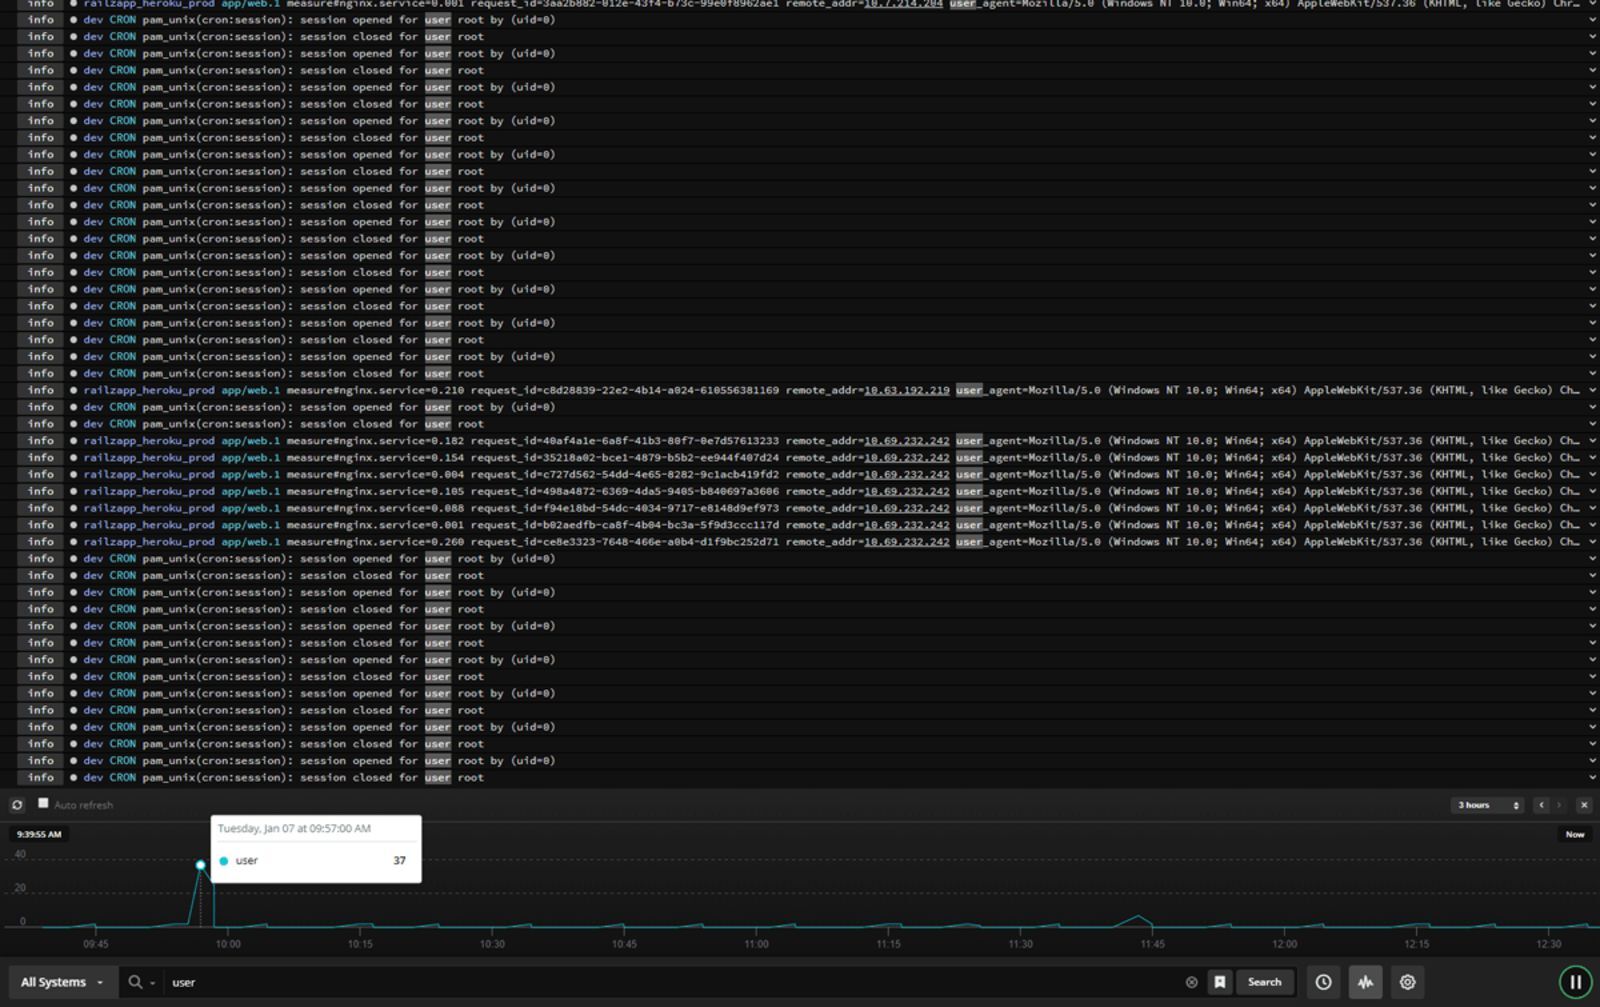
NGINX is a highly popular web server considered one of the fastest solutions on the market. You can use it for serving data for small, personal projects, as a reverse proxy, or as an enterprise-grade solution powering large e-commerce sites handling millions of users daily. It supports a wide range of capabilities, such as HTTP cache, load balancing, or even a mail proxy, and offers features such as HTTP/2, TLS offloading, WebSockets and gRPC.
To fully leverage its capabilities, you need to be aware of what is happening to your environment, and handling NGINX isn’t different. You should keep an eye on all the metrics it exposes and use its log files to fully understand the traffic coming to your servers.
In this blog post we will look at the top NGINX log analyzer tools that will help you ship, centralize, aggregate, and finally analyze log events to get a detailed picture of what is happening with your NGINX servers.
1. Sematext Logs
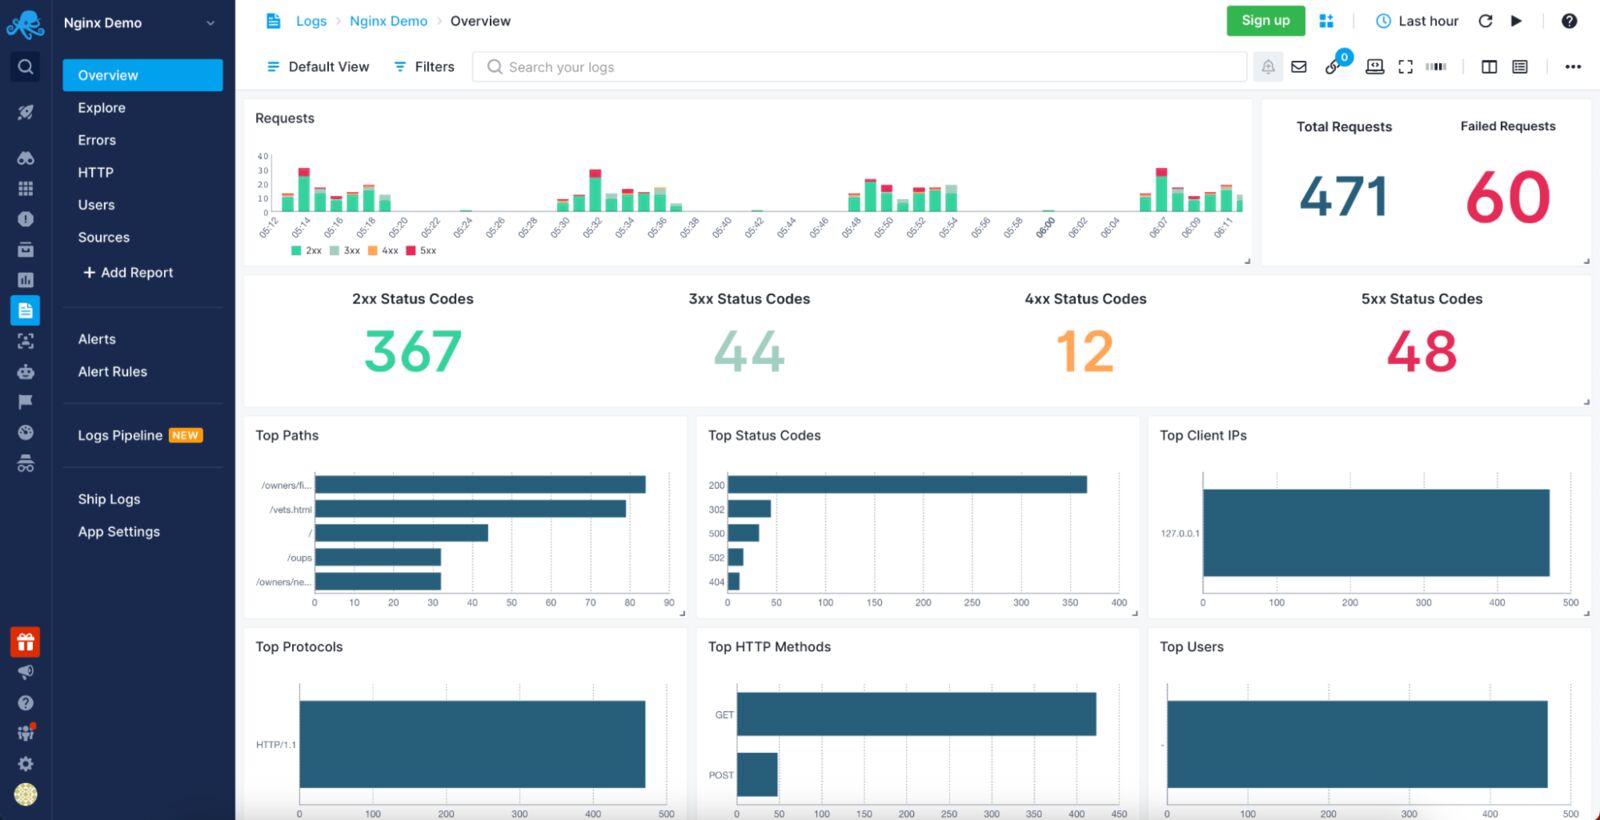
Sematext Logs is a log aggregation and analysis tool with first-class support for NGINX, allowing you to slice and dice through NGINX access and error logs to find the ones that are most important at the moment. Sematext Logs provide out-of-the-box dashboards with pre-configured visualizations showing you the most important information coming from your logs, like requests summary, number of requests with given response code and much more. You can correlate logs with events and metrics, live-tail logs, add alerts to logs, and use Google-like syntax for filtering. Its powerful search and filtering capabilities give you the log context needed to find log events occurring before and after the one you are currently looking at.
Sematext features auto-discovery of logs to help you centralize logs in highly scalable and dynamic environments, whether you are using bare metal, virtual machines, or containers. Along with the
Pros:
- Provides an agent with pre-configured parsing rules for NGINX and other common formats like Apache common or Java garbage collector.
- Ease of integration with the rest of the Sematext Cloud offerings like Experience (RUM), Synthetics, and Infrastructure Monitoring, giving you a full observability solution in a single tool. This is especially useful if you want to correlate the log data with NGINX metrics for quick root cause analysis.
- Accepts data from various sources that can ship data in Elasticsearch-compatible format allowing integration of log events from various sources inside your environment.
- Once shipped, you can manipulate the data via user-friendly Logs Pipelines that enable further data processing, such as numerical data extraction, IP to geolocation mapping and many more.
Cons:
- No support for unstructured text. You can only send JSON-formatted log events, use syslog to send data, or use the provided agent that supports a limited set of common formats. It won’t be an issue with NGINX log events but may become a limitation when dealing with many different log sources.
- It doesn’t allow mixing Kibana and Sematext native UI widgets in a single dashboard – it is one or the other.
Price:
Sematext Logs starts with a Basic plan allowing up to 500MB/day worth of logs and 7 days of data retention for free. The Standard plan has a limited set of features and starts at $50/month and includes 1GB/day and 7 days retention, which translates to around $0.1/GB of received data and $1.56/GB of stored data. The fully-featured Pro plan has Logs Pipelines, Log Archiving, and more, starting at around $60/month for 1GB/day of data and 7-day retention, meaning $0.1/GB of received data and $1.90/GB of stored data.
2. GoAccess
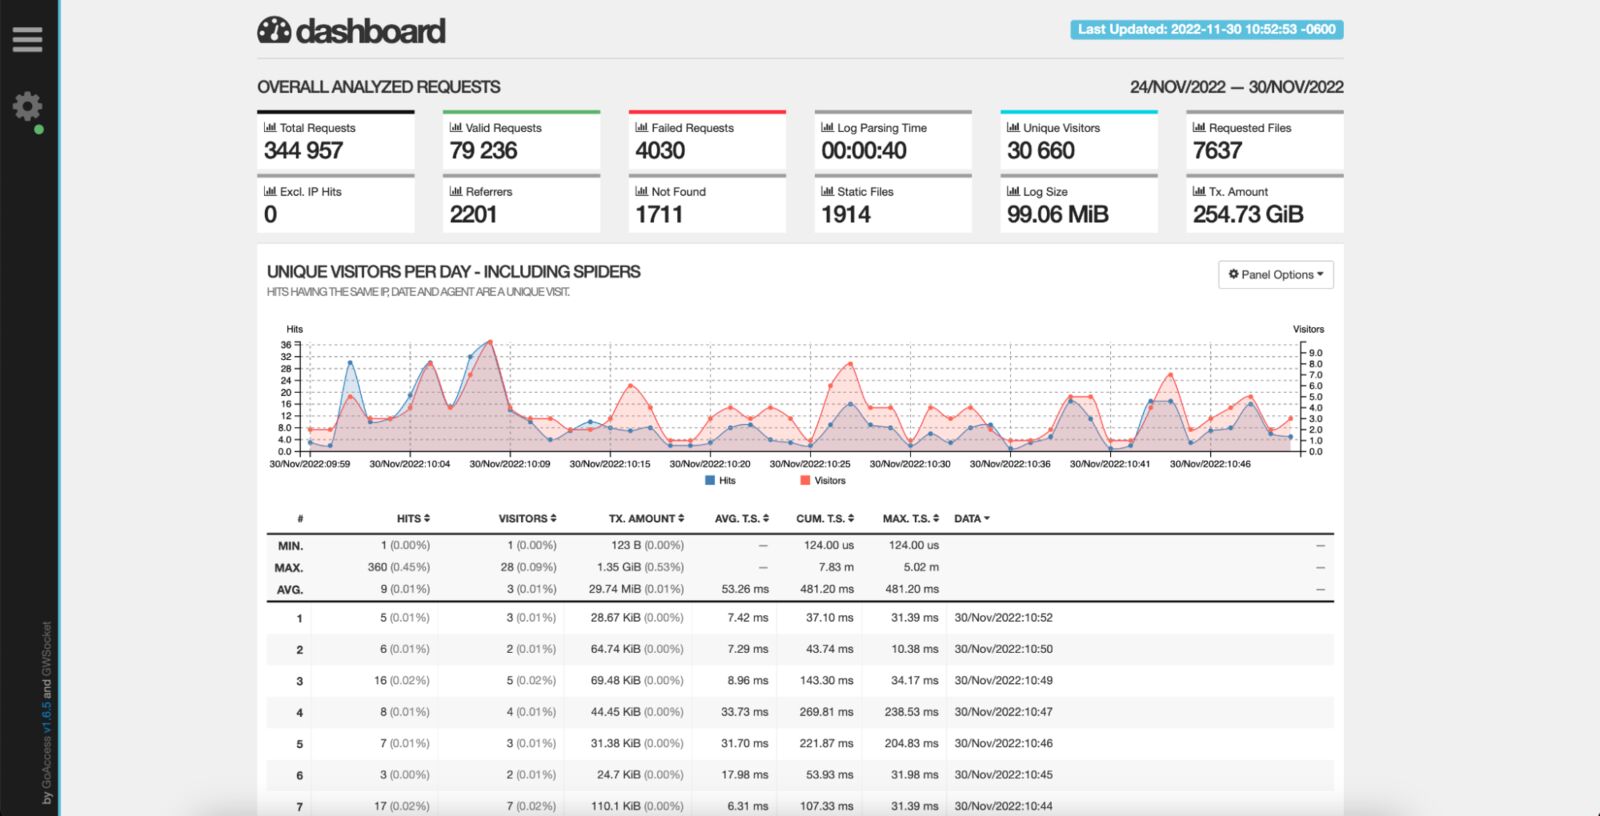
GoAccess is an open-source, real-time web log analyzer with NGINX log analysis capabilities. It works in the terminal if you lack access to the visual environment or via browser using a real-time generated HTML file. Incredibly fast, written in C, and supporting a wide range of web server formats, including NGINX, Apache and Amazon S3, it could be the only tool you need to process your NGINX logs and get all the necessary information out of them. The generated HTML files can be updated dynamically and provide details about requests, visitors, top URLs, 404 pages, IPs and hostnames of your visitors – these are only a few examples of the visualizations you get out of the box of this solution. On top of that, GoAccess supports virtual hosts, allowing you to easily identify which consumes the most resources.
Pros:
- First-class NGINX support that doesn’t need to be adjusted or configured.
- Minimal configuration needed to set up for NGINX logs.
- Beautiful terminal dashboard for hard-core site reliability engineers that prefer the dark terminal over rich web visualizations.
- Support for incremental log processing with the on-disk database.
Cons:
- Logs need to be centralized in a single shared place if you want to visualize all your NGINX hosts together.
Price:
GoAccess is an open-source and free-of-charge NGINX log analyzer.
3. Elastic Stack
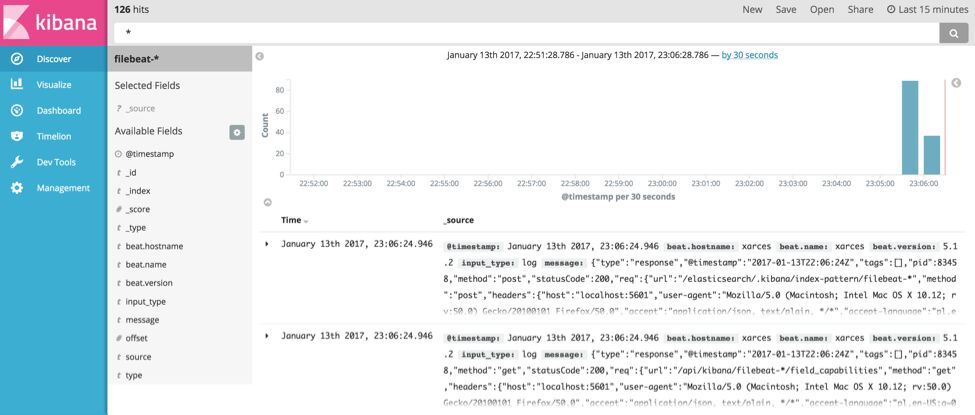
The Elastic Stack, formerly known as ELK Stack, is one of the most widely adopted tools used for analyzing logs for most of the available technologies, including NGINX. It started as the ELK trio combining Elasticsearch, the search and analytics engine; Logstash, the log processing and shipping tool; and Kibana, the visualization layer. Since then, it has evolved to include additional tools, such as Beats, a lightweight log shipper with NGINX support included.
The solution enables you to aggregate logs, slice and dice them and process them to enable rich analysis. You can extract every piece of NGINX log events and enrich them with location and security information. With its powerful aggregation engine, you can create dashboards showing you all the necessary details about your NGINX and the users interacting with it. Depending on your use case, you can install and run it in your environment or the cloud. And all these are available from a single vendor.
Pros:
- Logging support for virtually any kind of technology available, allowing easy correlation between events across your infrastructure, thus enabling faster troubleshooting.
- Scalable to support large data volume and long retention.
- Mature and configurable log shippers with native support for NGINX.
- Rich, virtually unlimited visualizations.
Cons:
- May be challenging to maintain at a larger scale, requiring in-depth knowledge.
- Limited features of the Basic version.
Price:
The Basic version of Elastic Stack is free but self-managed, so you need to consider what comes with it – maintenance. It has limited features, including machine learning which becomes available with the platinum-grade tier, which starts at $125 a month.
4. Datadog
Datadog is a unified solution that allows you to navigate from your NGINX logs to metrics, traces and back for efficient root cause analysis and performance comparison. It also provides live tail functionality to monitor your logs in near real time. All from a single vendor.
Datadog offers log analyzers with support for NGINX logging capabilities, giving you everything you need to analyze your NGINX log data. With support for more than 170 technologies, you can centralize your logs in a single place and extract the metrics out of it for dynamic altering. Further, you can prioritize the high-value logs to get a cost-effective and scalable approach to centralized log management.
Pros:
- On data ingestion processing allows you to ship virtually any format of log events and parse them on the solution side, including NGINX.
- Possibility to generate metrics out of NGINX logs allowing for rich dashboarding for your access and error logs.
- Real-time alerting with log-based custom metrics.
- TCP/SSL support with SOC 2 compliance for the highest security when it comes to logs.
- Rich extensibility of processing pipelines with more than 170 common technologies available.
Cons:
- Only self-hosted data archiving in the Ingest plan.
- Unlimited user accounts are available only in the more expensive plan.
Price:
Datadog offers two options for their log analyzer. The Ingest plan pricing starts at $0.10 per ingested or scanned GB of uncompressed data a month with process, live time and archive available. You also benefit from self-hosted archiving parsing the log events on data ingestion and log-based metrics. The second option is Retain or Rehydrate, an on-demand billing plan that’s priced at $2.25 per million log events per month and includes 15 days of logs retention based on tags or facets, log patterns and analytics, and log rehydration for auditing and historical analysis.
5. SolarWinds Loggly
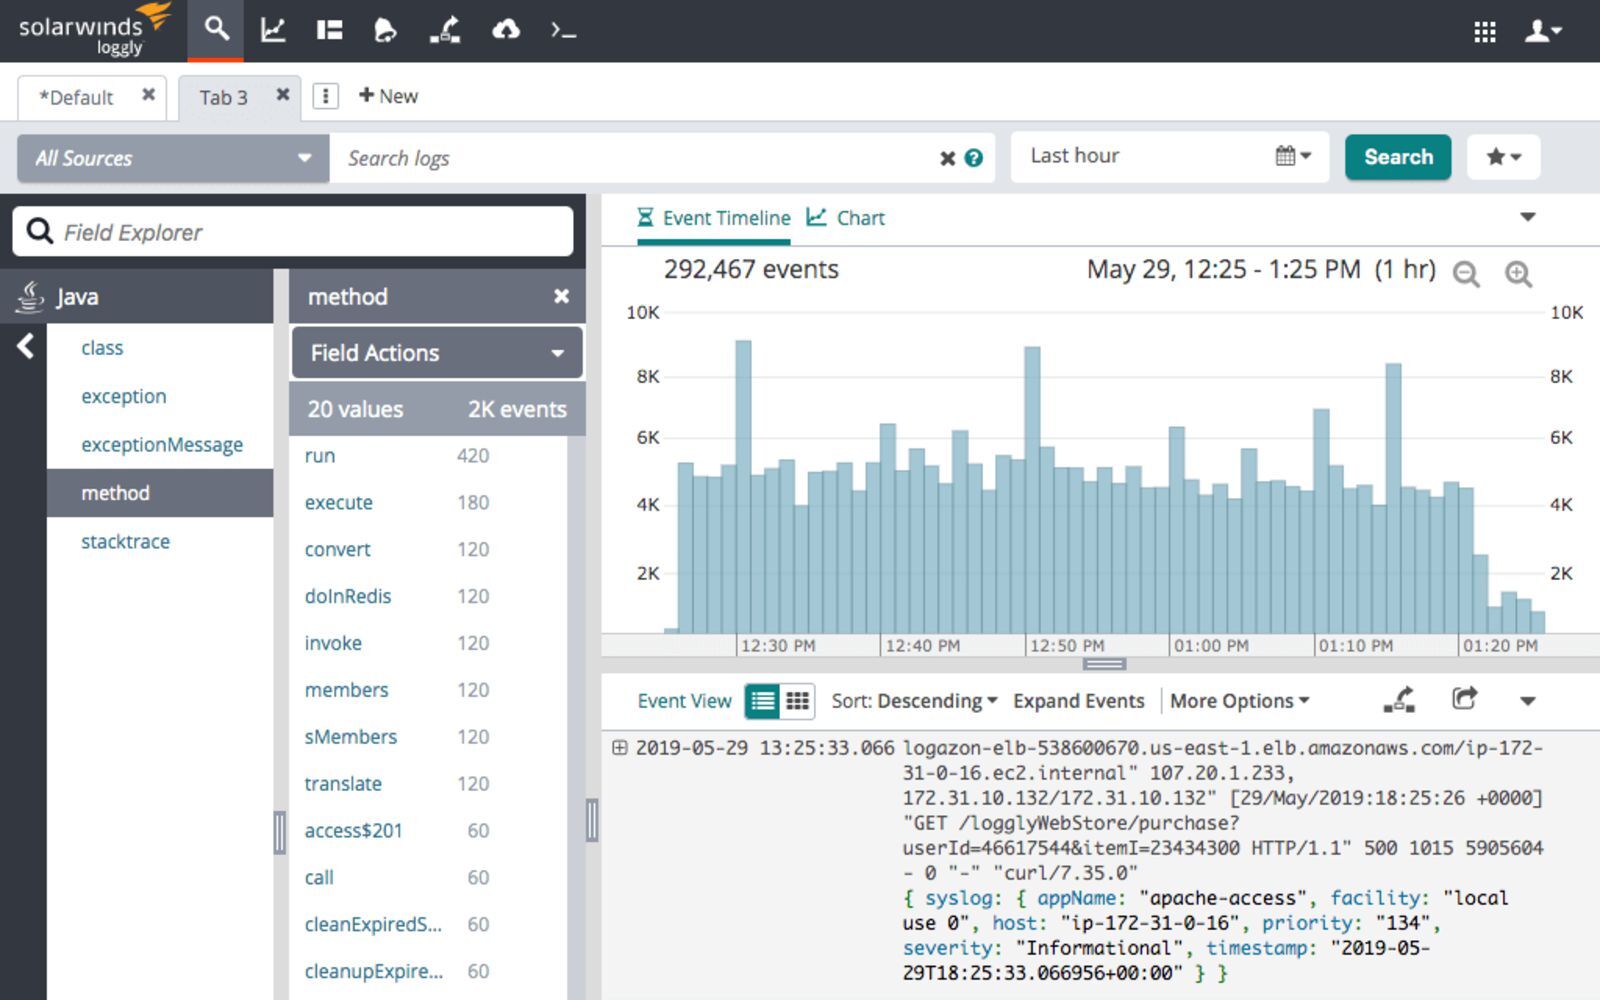
Loggly is a cloud-based log aggregation and management service that allows you to access and analyze your NGINX log data while giving you real-time insights into every detail of your NGINX logs. It’s a simple, yet efficient solution that uses well-established protocols such as HTTP or Syslog to ship the NGINX log data, so that you can choose the best way to ship each type of NGINX logs. The dynamic field explorer gives a real-time overview of your logs categorized by structure or customized view. And with its powerful full-text search capabilities you can search on individual fields to find the log events you are interested in – for example, the ones related to your most valuable URL handled by the NGINX server.
Pros:
- Server-side logs parsing, meaning that you don’t have to waste your server resources for log preparation.
- Agent-free logs collection enables easy shipping of NGINX logs.
- Support for popular log shippers.
- Parsing support for common log formats, including NGINX.
- Query time field extraction.
Cons:
- Some features, like API access, are only available when using higher plans, which can limit your log analysis process.
- Restrictive overage rules.
Price:
Loggly pricing starts with a free tier that includes 200MB/day of data ingestion with 7 days retention and includes basic functionality lacking alerting and customized dashboards. The paid plan starts at $79/month, billed annually for 1GB/day of data ingestion and 15 days retention, giving you access to a solution enriched with customized dashboards and email alerting. The Enterprise version starts at $279/month billed annually and includes all the features of the earlier plans, webhooks, custom daily data volume, and 15 to 90 days retention.
6. Sumo Logic
Sumo Logic is a unified logs platform with the first-class NGINX support. It features machine learning and predictive algorithms that enable daily processing of large amounts of data. The platform allows you to evaluate your NGINX server health, gain insights into the traffic origin and plan for resource allocation. Use various dashboards to track your users, see where most errors come from, and track requests and their trends across the platform.
Pros:
- Powerful query language.
- Automatic log patterns detection for easy NGINX integration.
- Centralized agents with easy setup supporting autoscaled environments.
- Rich visualization support to give you insights into every piece of NGINX logs.
Cons:
- Not available on-premises disqualifies the solution for some companies.
- No overage support.
Price:
Sumo Logic pricing is based on features and data ingestion. You can start with a free plan with limited features and up to 500MB daily data ingestion. The paid plans start with the Essential, which has log analytics, real-time alerting, and live and historical data dashboarding, costing you around $93/GB (an estimated cost based on annual commitment and 30 days data retention).
7. Papertrail
SolarWinds Papertrail is a cloud-hosted log aggregation and management tool with NGINX support and great features for log analysis. It allows you to search and analyze any type of log file, text log file, or data coming via the Syslog protocol. Using this protocol, Papertrail enables you to ship large amounts of log data very efficiently, making it a very good choice as an NGINX log analyzer.
Papertrail feels very much like using the console – its live tail search helps detect issues faster and trace back the chain of events to enable real-time root cause analysis. You can filter your NGINX log events by source, date, log severity level, user IP address, or message contents to focus on the most meaningful data.
Pros:
- Simple and user-friendly interface that mimics the console experience will help you focus on what is crucial in your NGINX log events.
- Built-in archiving of the data makes it easy to work with large volumes of NGINX log events.
- Data ingestion is calculated monthly, making the service spike-friendly, which is advantageous when dealing with NGINX and services having spiky behavior, such as e-commerce.
Cons:
- No rich visualization support.
- Overage is limited to 200% of the plan, which can result in logs dropping, especially for services with spiky traffic.
- Higher volume plans become expensive compared to other services especially considering limited visualization capabilities.
Price:
The pricing starts at $0 for 2 days worth of searchable data and 7 days archive with 50MB/month of data (with 16GB free as a first-month bonus). The paid plans start at $7 for 1GB/month of data, with the data being searchable for 1 week and archived for a year. The most expensive non-custom plan we can see is $230 for 25GB/month of data available for two weeks for searching and one year of archiving.
Conclusion
Understanding the traffic hosted by your NGINX instances is crucial for having a healthy working environment and reacting to the trends your users are following or creating. Understanding the logs can help you quickly identify issues in your environment and intervene immediately, resulting in the best user experience for everyone using your services. This is why you need a tool for gathering, centralizing, processing and analyzing the log events coming from your NGINX servers. Hopefully, this blog post gave you an overview of the potential solutions you can consider when looking for the right NGINX log analyzer for your use case.
Start Free Trial
In this tutorial, you will learn everything you need to know about logging in
NGINX and how it can help you troubleshoot and quickly resolve any problem you
may encounter on your web server. We will discuss where the logs are stored and
how to access them, how to customize their format, and how to centralize them in
one place with Syslog or a log management service.
Here’s an outline of what you will learn by following through with this tutorial:
- Where NGINX logs are stored and how to access them.
- How to customize the NGINX log format and storage location to fit your needs.
- How to utilize a structured format (such as JSON) for your NGINX logs.
- How to centralize NGINX logs through Syslog or a managed cloud-based service.
Prerequisites
To follow through with this tutorial, you need the following:
- A Linux server that includes a non-root user with
sudoprivileges. We tested
the commands shown in this guide on an Ubuntu 20.04 server. - The
NGINX web server installed
and enabled on your server.
🔭 Want to centralize and monitor your NGINX logs?
Head over to Logtail and start ingesting your logs in 5 minutes.
Step 1 — Locating the NGINX log files
NGINX writes logs of all its events in two different log files:
- Access log: this file contains information about incoming requests and
user visits. - Error log: this file contains information about errors encountered while
processing requests, or other diagnostic messages about the web server.
The location of both log files is dependent on the host operating system of the
NGINX web server and the mode of installation. On most Linux distributions, both
files will be found in the /var/log/nginx/ directory as access.log and
error.log, respectively.
A typical access log entry might look like the one shown below. It describes an
HTTP GET request to the server for a favicon.ico file.
217.138.222.101 - - [11/Feb/2022:13:22:11 +0000] "GET /favicon.ico HTTP/1.1" 404 3650 "http://135.181.110.245/" "Mozilla/5.0 (Windows NT 10.0; Win64; x64) AppleWebKit/537.36 (KHTML, like Gecko) Chrome/98.0.4758.87 Safari/537.36" "-"
Similarly, an error log entry might look like the one below, which was generated
due to the inability of the server to locate the favicon.ico file that was
requested above.
2022/02/11 13:12:24 [error] 37839#37839: *7 open() "/usr/share/nginx/html/favicon.ico" failed (2: No such file or directory), client: 113.31.102.176, server: _, request: "GET /favicon.ico HTTP/1.1", host: "192.168.110.245:80"
In the next section, you’ll see how to view both NGINX log files from the
command line.
Step 2 — Viewing the NGINX log files
Examining the NGINX logs can be done in a variety of ways. One of the most
common methods involves using the tail command to view logs entries in
real-time:
sudo tail -f /var/log/nginx/access.log
You will observe the following output:
107.189.10.196 - - [14/Feb/2022:03:48:55 +0000] "POST /HNAP1/ HTTP/1.1" 404 134 "-" "Mozila/5.0"
35.162.122.225 - - [14/Feb/2022:04:11:57 +0000] "GET /.env HTTP/1.1" 404 162 "-" "Mozilla/5.0 (Windows NT 10.0; Win64; x64; rv:58.0) Gecko/20100101 Firefox/58.0"
45.61.172.7 - - [14/Feb/2022:04:16:54 +0000] "GET /.env HTTP/1.1" 404 197 "-" "Mozilla/5.0 (X11; Linux x86_64) AppleWebKit/537.36 (KHTML, like Gecko) Chrome/81.0.4044.129 Safari/537.36"
45.61.172.7 - - [14/Feb/2022:04:16:55 +0000] "POST / HTTP/1.1" 405 568 "-" "Mozilla/5.0 (X11; Linux x86_64) AppleWebKit/537.36 (KHTML, like Gecko) Chrome/81.0.4044.129 Safari/537.36"
45.137.21.134 - - [14/Feb/2022:04:18:57 +0000] "GET /dispatch.asp HTTP/1.1" 404 134 "-" "Mozilla/5.0 (iPad; CPU OS 7_1_2 like Mac OS X; en-US) AppleWebKit/531.5.2 (KHTML, like Gecko) Version/4.0.5 Mobile/8B116 Safari/6531.5.2"
23.95.100.141 - - [14/Feb/2022:04:42:23 +0000] "HEAD / HTTP/1.0" 200 0 "-" "-"
217.138.222.101 - - [14/Feb/2022:07:38:40 +0000] "GET /icons/ubuntu-logo.png HTTP/1.1" 404 197 "http://168.119.119.25/" "Mozilla/5.0 (Windows NT 10.0; Win64; x64) AppleWebKit/537.36 (KHTML, like Gecko) Chrome/98.0.4758.87 Safari/537.36"
217.138.222.101 - - [14/Feb/2022:07:38:42 +0000] "GET /favicon.ico HTTP/1.1" 404 197 "http://168.119.119.25/" "Mozilla/5.0 (Windows NT 10.0; Win64; x64) AppleWebKit/537.36 (KHTML, like Gecko) Chrome/98.0.4758.87 Safari/537.36"
217.138.222.101 - - [14/Feb/2022:07:44:02 +0000] "GET / HTTP/1.1" 304 0 "-" "Mozilla/5.0 (Windows NT 10.0; Win64; x64) AppleWebKit/537.36 (KHTML, like Gecko) Chrome/98.0.4758.87 Safari/537.36"
217.138.222.101 - - [14/Feb/2022:07:44:02 +0000] "GET /icons/ubuntu-logo.png HTTP/1.1" 404 197 "http://168.119.119.25/" "Mozilla/5.0 (Windows NT 10.0; Win64; x64) AppleWebKit/537.36 (KHTML, like Gecko) Chrome/98.0.4758.87 Safari/537.36"
The tail command prints the last 10 lines from the selected file. The -f
option causes it to continue displaying subsequent lines that are added to the
file in real-time.
To examine the entire contents of an NGINX log file, you can use the cat
command or open it in your text editor:
sudo cat /var/log/nginx/error.log
If you want to filter the lines that contain a specific term, you can use the
grep command as shown below:
sudo grep "GET /favicon.ico" /var/log/nginx/access.log
The command above will print all the lines that contain GET /favicon.ico so we
can see how many requests were made for that resource.
Step 3 — Configuring NGINX access logs
The NGINX access log stores data about incoming client requests to the server
which is beneficial when deciphering what users are doing in the application,
and what resources are being requested. In this section, you will learn how to
configure what data is stored in the access log.
One thing to keep in mind while following through with the instructions below is
that you’ll need to restart the nginx service after modifying the config file
so that the changes can take effect.
sudo systemctl restart nginx
Enabling the access log
The NGINX access Log should be enabled by default. However, if this is not the
case, you can enable it manually in the Nginx configuration file
(/etc/nginx/nginx.conf) using the access_log directive within the http
block.
http {
  access_log /var/log/nginx/access.log;
}
This directive is also applicable in the server and location configuration
blocks for a specific website:
server {
   access_log /var/log/nginx/app1.access.log;

  location /app2 {
    access_log /var/log/nginx/app2.access.log;
  }
}
Disabling the access log
In cases where you’d like to disable the NGINX access log, you can use the
special off value:
You can also disable the access log on a virtual server or specific URIs by
editing its server or location block configuration in the
/etc/nginx/sites-available/ directory:
server {
  listen 80;

  access_log off;

  location ~* .(woff|jpg|jpeg|png|gif|ico|css|js)$ {
    access_log off;
  }
}
Logging to multiple access log files
If you’d like to duplicate the access log entries in separate files, you can do
so by repeating the access_log directive in the main config file or in a
server block as shown below:
access_log /var/log/nginx/access.log;
access_log /var/log/nginx/combined.log;
Don’t forget to restart the nginx service afterward:
sudo systemctl restart nginx
Explanation of the default access log format
The access log entries produced using the default configuration will look like
this:
127.0.0.1 alice Alice [07/May/2021:10:44:53 +0200] "GET / HTTP/1.1" 200 396 "-" "Mozilla/5.0 (Windows NT 10.0; Win64; x64) AppleWebKit/537.36 (KHTML, like Gecko) Chrome/90.0.4531.93 Safari/537.36"
Here’s a breakdown of the log message above:
127.0.0.1: the IP address of the client that made the request.alice: remote log name (name used to log in a user).Alice: remote username (username of logged-in user).[07/May/2021:10:44:53 +0200]: date and time of the request."GET / HTTP/1.1": request method, path and protocol.200: the HTTP response code.396: the size of the response in bytes."-": the IP address of the referrer (-is used when the it is not
available)."Mozilla/5.0 (Windows NT 10.0; Win64; x64) AppleWebKit/537.36 (KHTML, like Gecko) Chrome/90.0.4531.93 Safari/537.36"—
detailed user agent information.
Step 4 — Creating a custom log format
Customizing the format of the entries in the access log can be done using the
log_format directive, and it can be placed in the http, server or
location blocks as needed. Here’s an example of what it could look like:
log_format custom '$remote_addr - $remote_user [$time_local] ' '"$request" $status $body_bytes_sent ' '"$http_referer" "$http_user_agent"';
This yields a log entry in the following format:
217.138.222.109 - - [14/Feb/2022:10:38:35 +0000] "GET /favicon.ico HTTP/1.1" 404 197 "http://192.168.100.1/" "Mozilla/5.0 (Windows NT 10.0; Win64; x64) AppleWebKit/537.36 (KHTML, like Gecko) Chrome/98.0.4758.87 Safari/537.36"
The syntax for configuring an access log format is shown below. First, you need
to specify a nickname for the format that will be used as its identifier, and
then the log format string that represents the details and formatting for each
log message.
log_format <nickname> '<formatting_variables>';
Here’s an explanation of each variable used in the custom log format shown
above:
$remote_addr: the IP address of the client$remote_user: information about the user making the request$time_local: the server’s date and time.$request: actual request details like path, method, and protocol.$status: the response code.$body_bytes_sent: the size of the response in bytes.$http_referer: the IP address of the HTTP referrer.$http_user_agent: detailed user agent information.
You may also use the following variables in your custom log format
(see here for the complete list):
$upstream_connect_time: the time spent establishing a connection with an
upstream server.$upstream_header_time: the time between establishing a connection and
receiving the first byte of the response header from the upstream server.$upstream_response_time: the time between establishing a connection and
receiving the last byte of the response body from the upstream server.$request_time: the total time spent processing a request.$gzip_ratio: ration of gzip compression (if gzip is enabled).
After you create a custom log format, you can apply it to a log file by
providing a second parameter to the access_log directive:
access_log /var/log/nginx/access.log custom;
You can use this feature to log different information in to separate log files.
Create the log formats first:
log_format custom '$remote_addr - $remote_user [$time_local] ' '"$request" $status $body_bytes_sent ' '"$http_referer"';
log_format agent "$http_user_agent";
Then, apply them as shown below:
access_log /var/log/nginx/access.log custom;
access_log /var/log/nginx/agent_access.log agent;
This configuration ensures that user agent information for all incoming requests
are logged into a separate access log file.
Step 5 — Formatting your access logs as JSON
A common way to customize NGINX access logs is to format them as JSON. This is
quite straightforward to achieve by combining the log_format directive with
the escape=json parameter introduced in Nginx 1.11.8 to escape characters that
are not valid in JSON:
log_format custom_json escape=json
  '{'
    '"time_local":"$time_local",'
    '"remote_addr":"$remote_addr",'
    '"remote_user":"$remote_user",'
    '"request":"$request",'
    '"status": "$status",'
    '"body_bytes_sent":"$body_bytes_sent",'
    '"request_time":"$request_time",'
    '"http_referrer":"$http_referer",'
    '"http_user_agent":"$http_user_agent"'
  '}';
After applying the custom_json format to a log file and restarting the nginx
service, you will observe log entries in the following format:
{
  "time_local": "14/Feb/2022:11:25:44 +0000",
  "remote_addr": "217.138.222.109",
  "remote_user": "",
  "request": "GET /icons/ubuntu-logo.png HTTP/1.1",
  "status": "404",
  "body_bytes_sent": "197",
  "request_time": "0.000",
  "http_referrer": "http://192.168.100.1/",
  "http_user_agent": "Mozilla/5.0 (Windows NT 10.0; Win64; x64) AppleWebKit/537.36 (KHTML, like Gecko) Chrome/98.0.4758.87 Safari/537.36"
}
Step 6 — Configuring NGINX error logs
Whenever NGINX encounters an error, it stores the event data in the error log so
that it can be referred to later by a system administrator. This section will
describe how to enable and customize the error logs as you see fit.
Enabling the error log
The NGINX error log should be enabled by default. However, if this is not the
case, you can enable it manually in the relevant NGINX configuration file
(either at the http, server, or location levels) using the error_log
directive.
error_log /var/log/nginx/error.log;
The error_log directive can take two parameters. The first one is the location
of the log file (as shown above), while the second one is optional and sets the
severity level of the log. Events with a lower severity level than set one will
not be logged.
error_log /var/log/nginx/error.log info;
These are the possible levels of severity (from lowest to highest) and their
meaning:
debug: messages used for debugging.info: informational messages.notice: a notable event occurred.warn: something unexpected happened.error: something failed.crit: critical conditions.alert: errors that require immediate action.emerg: the system is unusable.
Disabling the error log
The NGINX error log can be disabled by setting the error_log directive to
off or by redirecting it to /dev/null:
error_log off;
error_log /dev/null;
Logging errors into multiple files
As is the case with access logs, you can log errors into multiple files, and you
can use different severity levels too:
error_log /var/log/nginx/error.log info;
error_log /var/log/nginx/emerg_error.log emerg;
This configuration will log every event except those at the debug level event
to the error.log file, while emergency events are placed in a separate
emerg_error.log file.
Step 7 — Sending NGINX logs to Syslog
Apart from logging to a file, it’s also possible to set up NGINX to transport
its logs to the syslog service especially if you’re already using it for other
system logs. Logging to syslog is done by specifying the syslog: prefix to
either the access_log or error_log directive:
error_log  syslog:server=unix:/var/log/nginx.sock debug;
access_log syslog:server=[127.0.0.1]:1234,facility=local7,tag=nginx,severity=info;
Log messages are sent to a server which can be specified in terms of a domain
name, IPv4 or IPv6 address or a UNIX-domain socket path.
In the example above, error log messages are sent to a UNIX domain socket at the
debug logging level, while the access log is written to a syslog server with
an IPv4 address and port 1234. The facility= parameter specifies the type of
program that is logging the message, the tag= parameter applies a custom tag
to syslog messages, and the severity= parameter sets the severity level of
the syslog entry for access log messages.
For more information on using Syslog to manage your logs, you can check out our
tutorial on viewing and configuring system logs on
Linux.
Step 8 — Centralizing your NGINX logs
In this section, we’ll describe how you can centralize your NGINX logs in a log
management service through Vector, a
high-performance tool for building observability pipelines. This is a crucial
step when administrating multiple servers so that you can monitor all your logs
in one place (you can also centralize your logs with an Rsyslog
server).
The following instructions assume that you’ve signed up for a free
Logtail account and retrieved your source
token. Go ahead and follow the relevant
installation instructions for Vector
for your operating system. For example, on Ubuntu, you may run the following
commands to install the Vector CLI:
curl -1sLf  'https://repositories.timber.io/public/vector/cfg/setup/bash.deb.sh'  | sudo -E bash
$ sudo apt install vector
After Vector is installed, confirm that it is up and running through
systemctl:
You should observe that it is active and running:
● vector.service - Vector
     Loaded: loaded (/lib/systemd/system/vector.service; enabled; vendor preset: enabled)
     Active: active (running) since Tue 2022-02-08 10:52:59 UTC; 48s ago
       Docs: https://vector.dev
    Process: 18586 ExecStartPre=/usr/bin/vector validate (code=exited, status=0/SUCCESS)
   Main PID: 18599 (vector)
      Tasks: 3 (limit: 2275)
     Memory: 6.8M
     CGroup: /system.slice/vector.service
             └─18599 /usr/bin/vector
Otherwise, go ahead and start it with the command below.
sudo systemctl start vector
Afterward, change into a root shell and append your Logtail vector configuration
for NGINX into the /etc/vector/vector.toml file using the command below. Don’t
forget to replace the <your_logtail_source_token> placeholder below with your
source token.
sudo -s
$ wget -O ->> /etc/vector/vector.toml
    https://logtail.com/vector-toml/nginx/<your_logtail_source_token>
Then restart the vector service:
sudo systemctl restart vector
You will observe that your NGINX logs will start coming through in Logtail:
Conclusion
In this tutorial, you learned about the different types of logs that the NGINX
web server keeps, where you can find them, how to understand their formatting.
We also discussed how to create your own custom log formats (including a
structured JSON format), and how to log into multiple files at once. Finally, we
demonstrated the process of sending your logs to Syslog or a log management
service so that you can monitor them all in one place.
Thanks for reading, and happy logging!
Centralize all your logs into one place.
Analyze, correlate and filter logs with SQL.
Create actionable
dashboards.
Share and comment with built-in collaboration.
Got an article suggestion?
Let us know
![]()
![]()
![]()
Next article
How to Get Started with Logging in Node.js
Learn how to start logging with Node.js and go from basics to best practices in no time.
→
![]()
This work is licensed under a Creative Commons Attribution-NonCommercial-ShareAlike 4.0 International License.
<?xml version=«1.0« encoding=«UTF-8«?> <zabbix_export> <version>3.2</version> <date>2018-06-18T18:43:50Z</date> <groups> <group> <name>!Templates</name> </group> </groups> <templates> <template> <template>nginx lua status</template> <name>nginx lua status</name> <description/> <groups> <group> <name>!Templates</name> </group> </groups> <applications> <application> <name>Nginx</name> </application> </applications> <items> <item> <name>nginx http code 200</name> <type>2</type> <snmp_community/> <multiplier>0</multiplier> <snmp_oid/> <key>http200</key> <delay>0</delay> <history>30</history> <trends>60</trends> <status>0</status> <value_type>3</value_type> <allowed_hosts/> <units/> <delta>2</delta> <snmpv3_contextname/> <snmpv3_securityname/> <snmpv3_securitylevel>0</snmpv3_securitylevel> <snmpv3_authprotocol>0</snmpv3_authprotocol> <snmpv3_authpassphrase/> <snmpv3_privprotocol>0</snmpv3_privprotocol> <snmpv3_privpassphrase/> <formula>1</formula> <delay_flex/> <params/> <ipmi_sensor/> <data_type>0</data_type> <authtype>0</authtype> <username/> <password/> <publickey/> <privatekey/> <port/> <description/> <inventory_link>0</inventory_link> <applications> <application> <name>Nginx</name> </application> </applications> <valuemap/> <logtimefmt/> </item> <item> <name>nginx http code 401</name> <type>2</type> <snmp_community/> <multiplier>0</multiplier> <snmp_oid/> <key>http401</key> <delay>0</delay> <history>30</history> <trends>60</trends> <status>0</status> <value_type>3</value_type> <allowed_hosts/> <units/> <delta>2</delta> <snmpv3_contextname/> <snmpv3_securityname/> <snmpv3_securitylevel>0</snmpv3_securitylevel> <snmpv3_authprotocol>0</snmpv3_authprotocol> <snmpv3_authpassphrase/> <snmpv3_privprotocol>0</snmpv3_privprotocol> <snmpv3_privpassphrase/> <formula>1</formula> <delay_flex/> <params/> <ipmi_sensor/> <data_type>0</data_type> <authtype>0</authtype> <username/> <password/> <publickey/> <privatekey/> <port/> <description/> <inventory_link>0</inventory_link> <applications> <application> <name>Nginx</name> </application> </applications> <valuemap/> <logtimefmt/> </item> <item> <name>nginx http code 403</name> <type>2</type> <snmp_community/> <multiplier>0</multiplier> <snmp_oid/> <key>http403</key> <delay>0</delay> <history>30</history> <trends>60</trends> <status>0</status> <value_type>3</value_type> <allowed_hosts/> <units/> <delta>2</delta> <snmpv3_contextname/> <snmpv3_securityname/> <snmpv3_securitylevel>0</snmpv3_securitylevel> <snmpv3_authprotocol>0</snmpv3_authprotocol> <snmpv3_authpassphrase/> <snmpv3_privprotocol>0</snmpv3_privprotocol> <snmpv3_privpassphrase/> <formula>1</formula> <delay_flex/> <params/> <ipmi_sensor/> <data_type>0</data_type> <authtype>0</authtype> <username/> <password/> <publickey/> <privatekey/> <port/> <description/> <inventory_link>0</inventory_link> <applications> <application> <name>Nginx</name> </application> </applications> <valuemap/> <logtimefmt/> </item> <item> <name>nginx http code 404</name> <type>2</type> <snmp_community/> <multiplier>0</multiplier> <snmp_oid/> <key>http404</key> <delay>0</delay> <history>30</history> <trends>60</trends> <status>0</status> <value_type>3</value_type> <allowed_hosts/> <units/> <delta>2</delta> <snmpv3_contextname/> <snmpv3_securityname/> <snmpv3_securitylevel>0</snmpv3_securitylevel> <snmpv3_authprotocol>0</snmpv3_authprotocol> <snmpv3_authpassphrase/> <snmpv3_privprotocol>0</snmpv3_privprotocol> <snmpv3_privpassphrase/> <formula>1</formula> <delay_flex/> <params/> <ipmi_sensor/> <data_type>0</data_type> <authtype>0</authtype> <username/> <password/> <publickey/> <privatekey/> <port/> <description/> <inventory_link>0</inventory_link> <applications> <application> <name>Nginx</name> </application> </applications> <valuemap/> <logtimefmt/> </item> <item> <name>nginx http code 500</name> <type>2</type> <snmp_community/> <multiplier>0</multiplier> <snmp_oid/> <key>http500</key> <delay>0</delay> <history>30</history> <trends>60</trends> <status>0</status> <value_type>3</value_type> <allowed_hosts/> <units/> <delta>2</delta> <snmpv3_contextname/> <snmpv3_securityname/> <snmpv3_securitylevel>0</snmpv3_securitylevel> <snmpv3_authprotocol>0</snmpv3_authprotocol> <snmpv3_authpassphrase/> <snmpv3_privprotocol>0</snmpv3_privprotocol> <snmpv3_privpassphrase/> <formula>1</formula> <delay_flex/> <params/> <ipmi_sensor/> <data_type>0</data_type> <authtype>0</authtype> <username/> <password/> <publickey/> <privatekey/> <port/> <description/> <inventory_link>0</inventory_link> <applications> <application> <name>Nginx</name> </application> </applications> <valuemap/> <logtimefmt/> </item> <item> <name>nginx http code 501</name> <type>2</type> <snmp_community/> <multiplier>0</multiplier> <snmp_oid/> <key>http501</key> <delay>0</delay> <history>30</history> <trends>60</trends> <status>0</status> <value_type>3</value_type> <allowed_hosts/> <units/> <delta>2</delta> <snmpv3_contextname/> <snmpv3_securityname/> <snmpv3_securitylevel>0</snmpv3_securitylevel> <snmpv3_authprotocol>0</snmpv3_authprotocol> <snmpv3_authpassphrase/> <snmpv3_privprotocol>0</snmpv3_privprotocol> <snmpv3_privpassphrase/> <formula>1</formula> <delay_flex/> <params/> <ipmi_sensor/> <data_type>0</data_type> <authtype>0</authtype> <username/> <password/> <publickey/> <privatekey/> <port/> <description/> <inventory_link>0</inventory_link> <applications> <application> <name>Nginx</name> </application> </applications> <valuemap/> <logtimefmt/> </item> <item> <name>nginx http code 502</name> <type>2</type> <snmp_community/> <multiplier>0</multiplier> <snmp_oid/> <key>http502</key> <delay>0</delay> <history>30</history> <trends>60</trends> <status>0</status> <value_type>3</value_type> <allowed_hosts/> <units/> <delta>2</delta> <snmpv3_contextname/> <snmpv3_securityname/> <snmpv3_securitylevel>0</snmpv3_securitylevel> <snmpv3_authprotocol>0</snmpv3_authprotocol> <snmpv3_authpassphrase/> <snmpv3_privprotocol>0</snmpv3_privprotocol> <snmpv3_privpassphrase/> <formula>1</formula> <delay_flex/> <params/> <ipmi_sensor/> <data_type>0</data_type> <authtype>0</authtype> <username/> <password/> <publickey/> <privatekey/> <port/> <description/> <inventory_link>0</inventory_link> <applications> <application> <name>Nginx</name> </application> </applications> <valuemap/> <logtimefmt/> </item> <item> <name>nginx http code 503</name> <type>2</type> <snmp_community/> <multiplier>0</multiplier> <snmp_oid/> <key>http503</key> <delay>0</delay> <history>30</history> <trends>60</trends> <status>0</status> <value_type>3</value_type> <allowed_hosts/> <units/> <delta>2</delta> <snmpv3_contextname/> <snmpv3_securityname/> <snmpv3_securitylevel>0</snmpv3_securitylevel> <snmpv3_authprotocol>0</snmpv3_authprotocol> <snmpv3_authpassphrase/> <snmpv3_privprotocol>0</snmpv3_privprotocol> <snmpv3_privpassphrase/> <formula>1</formula> <delay_flex/> <params/> <ipmi_sensor/> <data_type>0</data_type> <authtype>0</authtype> <username/> <password/> <publickey/> <privatekey/> <port/> <description/> <inventory_link>0</inventory_link> <applications> <application> <name>Nginx</name> </application> </applications> <valuemap/> <logtimefmt/> </item> <item> <name>nginx http code 504</name> <type>2</type> <snmp_community/> <multiplier>0</multiplier> <snmp_oid/> <key>http504</key> <delay>0</delay> <history>30</history> <trends>60</trends> <status>0</status> <value_type>3</value_type> <allowed_hosts/> <units/> <delta>2</delta> <snmpv3_contextname/> <snmpv3_securityname/> <snmpv3_securitylevel>0</snmpv3_securitylevel> <snmpv3_authprotocol>0</snmpv3_authprotocol> <snmpv3_authpassphrase/> <snmpv3_privprotocol>0</snmpv3_privprotocol> <snmpv3_privpassphrase/> <formula>1</formula> <delay_flex/> <params/> <ipmi_sensor/> <data_type>0</data_type> <authtype>0</authtype> <username/> <password/> <publickey/> <privatekey/> <port/> <description/> <inventory_link>0</inventory_link> <applications> <application> <name>Nginx</name> </application> </applications> <valuemap/> <logtimefmt/> </item> </items> <discovery_rules/> <httptests/> <macros/> <templates/> <screens/> </template> </templates> <graphs> <graph> <name>Nginx http status codes</name> <width>900</width> <height>200</height> <yaxismin>0.0000</yaxismin> <yaxismax>100.0000</yaxismax> <show_work_period>1</show_work_period> <show_triggers>1</show_triggers> <type>0</type> <show_legend>1</show_legend> <show_3d>0</show_3d> <percent_left>0.0000</percent_left> <percent_right>0.0000</percent_right> <ymin_type_1>0</ymin_type_1> <ymax_type_1>0</ymax_type_1> <ymin_item_1>0</ymin_item_1> <ymax_item_1>0</ymax_item_1> <graph_items> <graph_item> <sortorder>0</sortorder> <drawtype>0</drawtype> <color>1A7C11</color> <yaxisside>0</yaxisside> <calc_fnc>4</calc_fnc> <type>0</type> <item> <host>nginx lua status</host> <key>http200</key> </item> </graph_item> <graph_item> <sortorder>1</sortorder> <drawtype>0</drawtype> <color>F63100</color> <yaxisside>0</yaxisside> <calc_fnc>4</calc_fnc> <type>0</type> <item> <host>nginx lua status</host> <key>http401</key> </item> </graph_item> <graph_item> <sortorder>2</sortorder> <drawtype>0</drawtype> <color>2774A4</color> <yaxisside>0</yaxisside> <calc_fnc>4</calc_fnc> <type>0</type> <item> <host>nginx lua status</host> <key>http403</key> </item> </graph_item> <graph_item> <sortorder>3</sortorder> <drawtype>0</drawtype> <color>A54F10</color> <yaxisside>0</yaxisside> <calc_fnc>4</calc_fnc> <type>0</type> <item> <host>nginx lua status</host> <key>http404</key> </item> </graph_item> <graph_item> <sortorder>4</sortorder> <drawtype>0</drawtype> <color>FC6EA3</color> <yaxisside>0</yaxisside> <calc_fnc>4</calc_fnc> <type>0</type> <item> <host>nginx lua status</host> <key>http500</key> </item> </graph_item> <graph_item> <sortorder>5</sortorder> <drawtype>0</drawtype> <color>6C59DC</color> <yaxisside>0</yaxisside> <calc_fnc>4</calc_fnc> <type>0</type> <item> <host>nginx lua status</host> <key>http501</key> </item> </graph_item> <graph_item> <sortorder>6</sortorder> <drawtype>0</drawtype> <color>AC8C14</color> <yaxisside>0</yaxisside> <calc_fnc>4</calc_fnc> <type>0</type> <item> <host>nginx lua status</host> <key>http502</key> </item> </graph_item> <graph_item> <sortorder>7</sortorder> <drawtype>0</drawtype> <color>611F27</color> <yaxisside>0</yaxisside> <calc_fnc>4</calc_fnc> <type>0</type> <item> <host>nginx lua status</host> <key>http503</key> </item> </graph_item> <graph_item> <sortorder>8</sortorder> <drawtype>0</drawtype> <color>F230E0</color> <yaxisside>0</yaxisside> <calc_fnc>4</calc_fnc> <type>0</type> <item> <host>nginx lua status</host> <key>http504</key> </item> </graph_item> </graph_items> </graph> </graphs> </zabbix_export>
Мониторинг является неотъемлимой частью любого современного бизнес процесса. При этом выполняется постоянное наблюдение за системой и в случае отклонения от некоторого установленного состояния имеется возможность мгновенного реагирования а иногда и автоматического устранения неисправности. Мониторинг компьютерных систем является сложнейшей задачей в виду огромного разнообразия сервисов, служб и параметров проверки. Поиски решения, которое максимально охватило бы все аспекты мониторинга привели меня к Zabbix. Это реализация клиент-серверной архитектуры с очень гибкими параметрами конфигурации как серверной так и клиентской части, что позволяет мониторить что и как угодно.
Со времён моего первого знакомства с этой системой прошло немало времени и zabbix превратился из просто хорошей в абсолютную систему. И тем не менее проект развивается.
В данном случае у меня имеется новенький сервер с только что установленной операционной системой CentOS 7 и самыми последними обновлениями. Zabbix имеет клиентскую часть, серверную часть и web-интерфейс управления системой. Все настройки и аналитические данные хранятся в базе данных(MySQL, PostgreSQL и т.д.) что добавляет удобства в поддержке, обновлении и переносе системы. Следовательно для полноценной работы сервиса нам потребуется настроить WEB-сервер и сервер баз данных(в данном случае MySQL).
Установка Nginx с официального репозитория
# vim /etc/yum.repos.d/nginx.repo
[nginx]
name=nginx repo
baseurl=http://nginx.org/packages/centos/7/$basearch/
gpgcheck=0
enabled=1
Так же для некоторых компонентов нам понадобится дополнительный репозиторий EPEL (Extra Packages for Enterprise Linux)
# yum install epel-release
# yum install nginx
# systemctl enable nginx
# systemctl start nginx
# yum install php-fpm phpmyadmin
На всякий случай устанавливаю и phpMyAdmin. Он тянет некоторые модули php, которые лишними точно не будут
По умолчанию менеджер процессов FastCGI запускается на 9000 порту. Я обычно изменяю эту настройку на использование доменных сокетов. Так шустрее и безопаснее.
# vim /etc/php-fpm.d/www.conf
;listen = 127.0.0.1:9000
listen = /var/run/php-fpm/php-fpm.sock
Забегая наперёд скажу, что нужно отредактировать некоторые параметры php. Если этого не сделать, то при установке веб-интерфейса Zabbix получим ошибку о нехватке ресурсов
Я правлю примерно так. Можно использовать текстовый редактор
# sed -i 's/^post_max_size.*/post_max_size=16M/' /etc/php.ini
# sed -i 's/^max_execution_time.*/max_execution_time=300/' /etc/php.ini
# sed -i 's/^max_input_time.*/max_input_time=300/' /etc/php.ini
# sed -i "s/^;date.timezone.*/date.timezone='Europe/Kiev'/" /etc/php.ini
# systemctl enable php-fpm
# systemctl start php-fpm
Ни для кого не секрет, что CentOS 7 претерпела серьёзных изменений. Вплоть до того, что теперь нельзя установить mysql-server. Вместо него теперь устанавливается mariadb-server.
Как заявляет разработчик MariaDB существенно лучше обычного MySQL и вот чем именно:
— Еще больше механизмов хранения данных
— Улучшенная производительность
— Расширения и новые возможности
— Улучшенное тестирование
— Меньше предупреждений и ошибок
— Настоящий Open Source
Не берусь комментировать, время покажет 🙂 Просто верим и просто устанавливаем:
# yum install mariadb mariadb-server
Работая некоторое время с заббиксом я узнал определённые нюансы, от которых попытаюсь Вас убереч
Хаускипер.
Камень преткновения Zabbix, если вовремя не обратить на него внимание.
Очистка истории (Housekeeper) — периодический процесс, выполняемый Zabbix сервером. Этот процесс удаляет устаревшую информацию и информацию удаленную пользователем. Так же историю хранимых действий и событий.
Zabbix сервер каждую минуту получает информацию о состоянии агента всех наблюдаемых серверов. В том числе о состоянии сервисов на каждом из хостов. Это довольно большой объём информации. При этом хранится информация за 365 дней. Рекомендуется установить реально необходимые сроки хранения истории.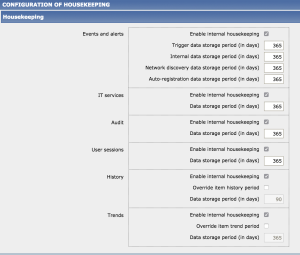
Установив даже самые короткие сроки информации будет много. По-этому рекомендуется рулить данные и средствами СУБД, а именно добавить параметр innodb_file_per_table. При добавления таблицы с механизмом InnoDB сервер MySQL будет создавать для неё отдельный файл .ibd для хранения данных и индексов
Это глобальный параметр и его нельзя просто сменить на уже работающем сервере. Для этого потребуется ещё ряд действий.
Добавим следующие строки в конфигурационный файл в секцию [mysqld]
# vim /etc/my.cnf
[mysqld]
innodb_file_per_table=1
innodb_flush_method=O_DIRECT
innodb_log_file_size=1G
innodb_buffer_pool_size=4G #(Устанавливается порядка 60-70 % от общей оперативной памяти)
innodb_strict_mode = 0
Сохраняем и запускаем в режиме безопасной установки:
# systemctl enable mariadb
# systemctl start mariadb
# mysql_secure_installation

Enter current password for root (enter for none):
OK, successfully used password, moving on...

Set root password? [Y/n] y
New password:
Re-enter new password:
Password updated successfully!

Remove anonymous users? [Y/n] y
 ... Success!

Disallow root login remotely? [Y/n] y
 ... Success!

Remove test database and access to it? [Y/n] y
 - Dropping test database...
 ... Success!
 - Removing privileges on test database...
 ... Success!

Reload privilege tables now? [Y/n] y
 ... Success!

Thanks for using MariaDB!
Что бы далеко не ходить сразу создадим БД, пользователя и доступ для zabbix.
Что бы русский язык корректно отображался кодировку по умолчанию ставлю UTF-8
# mysql -u root -p
Enter password:
Welcome to the MariaDB monitor.  Commands end with ; or g.
Your MariaDB connection id is 11
Server version: 5.5.41-MariaDB MariaDB Server

Copyright (c) 2000, 2014, Oracle, MariaDB Corporation Ab and others.

Type 'help;' or 'h' for help. Type 'c' to clear the current input statement.

MariaDB [(none)]> CREATE DATABASE zabbix CHARACTER SET utf8 COLLATE utf8_general_ci;

Query OK, 1 row affected (0.00 sec)

MariaDB [(none)]> grant all privileges on zabbix.* to zabbix@localhost identified by '$ecur3Z@bb!xp@$S';
Query OK, 0 rows affected (0.00 sec)

MariaDB [(none)]> flush privileges;
Query OK, 0 rows affected (0.00 sec)

MariaDB [(none)]> q
Bye
Подготовительные работы окончены. Дальше сам Zabbix. Для получения самых свежих пакетов можно установить релиз или добавить репозиторий вручную:
# yum localinstall http://repo.zabbix.com/zabbix/4.4/rhel/7/x86_64/zabbix-release-4.4-1.el7.noarch.rpm
# yum install php-pecl-mysql.x86_64
# yum -y install zabbix-server-mysql zabbix-agent zabbix-web-mysql
После установки необходимо создать структуру базы данных вручную имтортировав структуру и метаданные:
# zcat /usr/share/doc/zabbix-server-mysql-4.4.1/create.sql.gz | mysql -uzabbix -p zabbix
Enter password:
Последний шаг — настройка веб сервера:
# vim /etc/nginx/conf.d/default.conf

server {
    listen       80;
    server_name  zabbix.tradenark.com.ua www.zabbix.tradenark.com.ua;
    root /usr/share/zabbix;

    location / {
        root   /usr/share/zabbix;
        index  index.php index.html;
    }

    error_page   500 502 503 504  /50x.html;
    location = /50x.html {
        root   /usr/share/nginx/html;
    }


    location ~ .php$ {
        #root html;
        fastcgi_buffer_size 32k;
	fastcgi_buffers 4 32k;
        try_files $uri =404;
        fastcgi_pass unix:/var/run/php-fpm/php-fpm.sock;
        fastcgi_index index.php;
        fastcgi_param SCRIPT_FILENAME $document_root$fastcgi_script_name;
        include fastcgi_params;
    }


}
проверяем правила и перечитываем их:
# nginx -t
nginx: the configuration file /etc/nginx/nginx.conf syntax is ok
nginx: configuration file /etc/nginx/nginx.conf test is successful
# nginx -s reload
Перед установкой необходимо так же выставить необходимые права на запись
chown -R nginx:nginx /etc/zabbix/web/
Переходим к установке веб интерфейса
1) Приветствие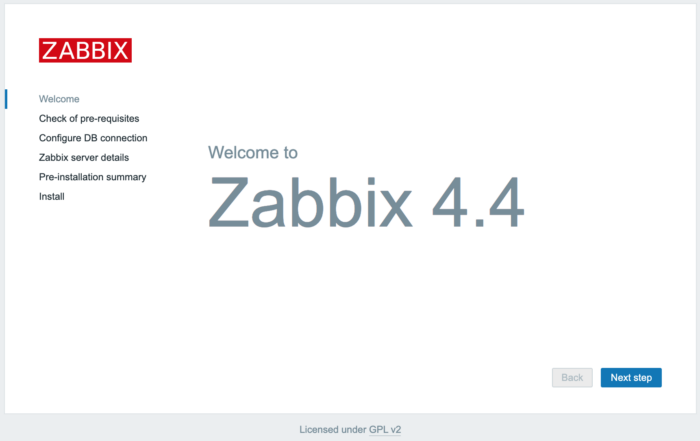
2) Проверка системных требований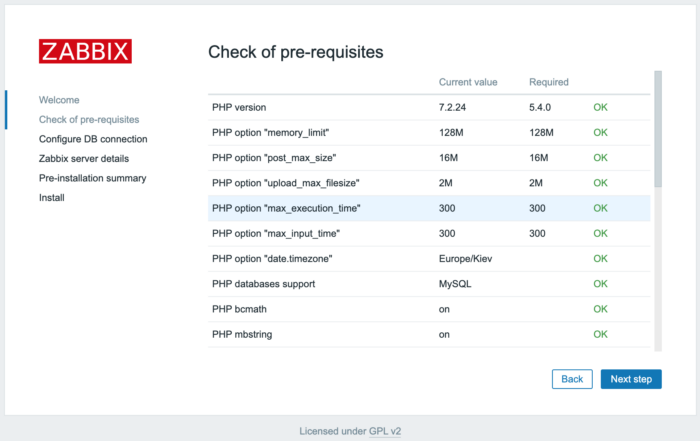
3) Установка соединения с сервером БД MySQL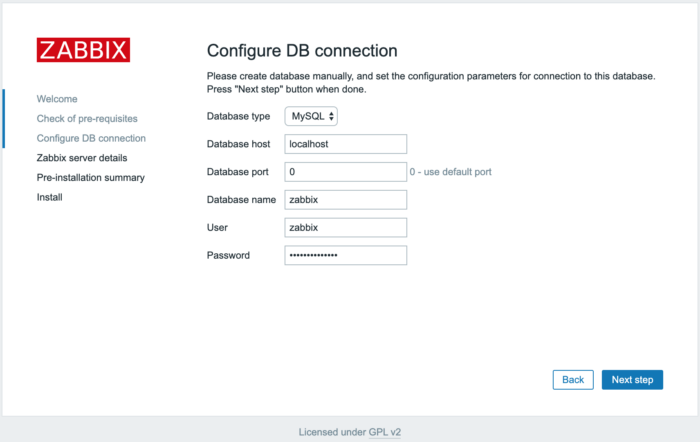
4) Имя и порт сервера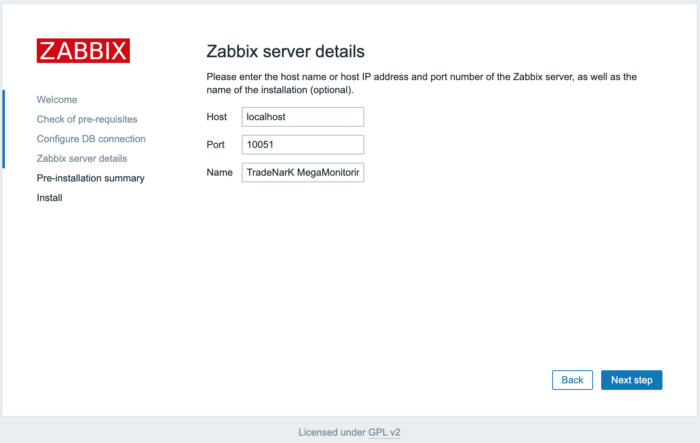
5) Итоговая информация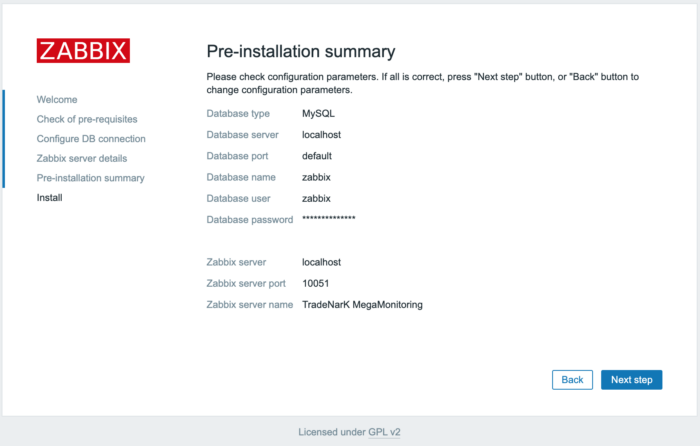
6) Сообщение об успешной установке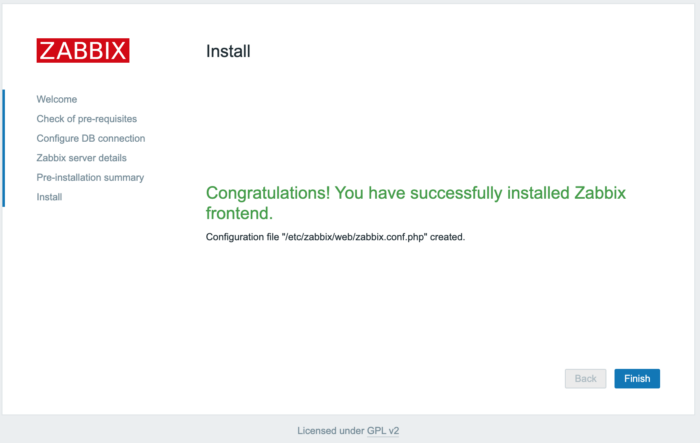
И теперь укажем в конфигурационном файле zabbix-сервера параметры соединения с БД
# sed -i 's/^# DBPassword=.*/DBPassword=$ecur3Z@bb!xp@$S/' /etc/zabbix/zabbix_server.conf
Добавим сервисы в автозагрузку и запустим их:
# systemctl enable zabbix-server
ln -s '/usr/lib/systemd/system/zabbix-server.service' '/etc/systemd/system/multi-user.target.wants/zabbix-server.service'
# systemctl enable zabbix-agent
ln -s '/usr/lib/systemd/system/zabbix-agent.service' '/etc/systemd/system/multi-user.target.wants/zabbix-agent.service'
# systemctl start zabbix-agent.service
# systemctl start zabbix-server.service
Можно заходить на веб интерфейс с логином admin(Admin с заглавной буквы тоже подходит) и паролем zabbix
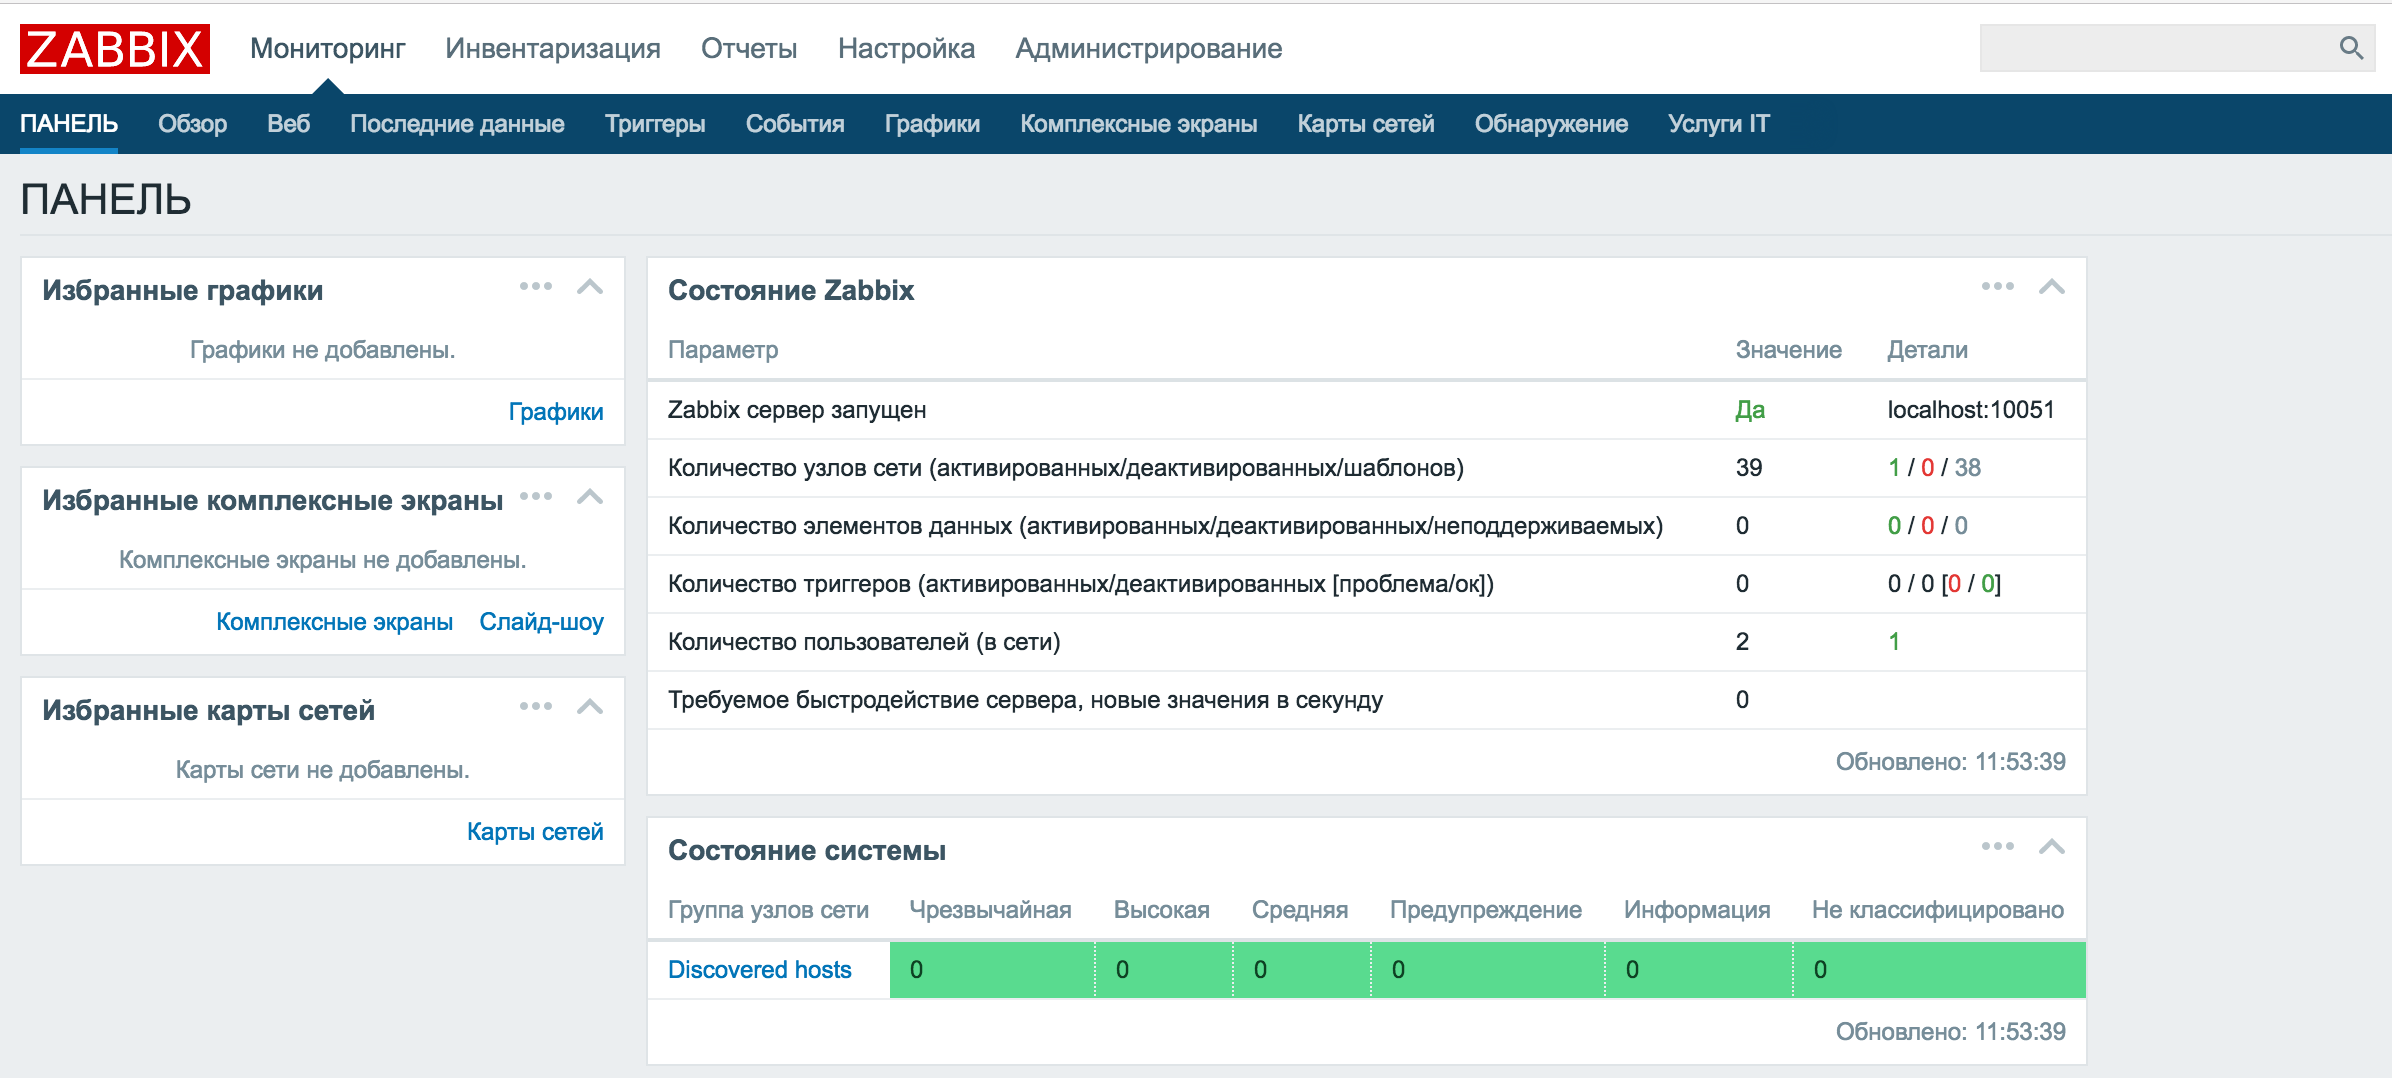
Естественно, первым делом устанавливаем свой пароль
UPD1:
Если получаем ошибку типа
Cannot display item queue.
Connection to Zabbix server "localhost" failed. Possible reasons:
1. Incorrect server IP/DNS in the "zabbix.conf.php";
2. Incorrect DNS server configuration.
Permission denied
То скорее всего необходимо отключить SELinux
# setenforce 0
Это до первой перезагрузки
Что бы отключить SELinux перманентно нужно в файле /etc/selinux/config исправить
SELINUX=enforcing
на
SELINUX=disabled
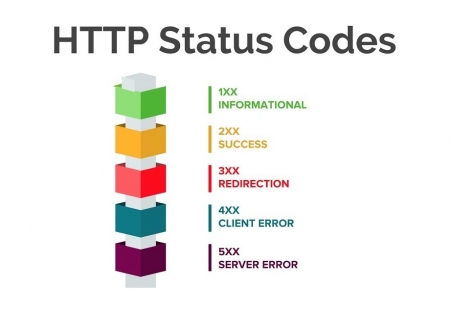
access log сайта расположен в /var/log/nginx/newsite_com_ssl_access.log
Пользователь zabbix от которого запущен агент Zabbix не имеет прав доступа на чтение лога.
Доступ к лог-файлам в директории /var/log/nginx имеет владелец www-data и группа adm. Проверить можно командой:
ls -l /var/log/nginx/ Для возможности чтения логов nginx, добавим пользователя zabbix в группу adm:
usermod -aG adm zabbixПосле изменений прав доступа пользователя zabbix, необходимо перезапустить агент Zabbix:
systemctl restart zabbix-agentПроверяем изменения, получаем последние записи лог-файла от имени пользователя zabbix:
sudo -u zabbix bash -c 'tail -f /var/log/nginx/newsite_com_ssl_access.log' Далее создадим элемент данных в Zabbix:
| Key | Value |
|---|---|
| Name | HTTP Status Codes |
| Type | Zabbix (active) |
| Key | log[/var/log/nginx/newsite_com_ssl_access.log,"^(S+) (S+) (S+) [([w:/]+s[+-]d{4})] "(S+)s?(S+)?s?(S+)?" (d{3}|-)",,,,8,,] |
| Type of Information | numeric (unsigned) |
| Update Interval | 1m |
Регулярное выражение: ^(S+) (S+) (S+) [([w:/]+s[+-]d{4})] "(S+)s?(S+)?s?(S+)?" (d{3}|-) (d+|-)s?"?([^"]*)"?s?"?([^"]*)" разбивает каждую строку лога на несколько групп. Код состояния HTTP находится в 8-й группе.
Второй вариант получения статус-кодов HTTP с помощью скрипта на bash:
vi /opt/get_response_http_codes.sh
#!/bin/bash

tail -n 1 /var/log/nginx/newsite_com_ssl_access.log | awk '{print $9}'
Меняем владельца скрипта и предоставляем права на выполнение:
chown zabbix /opt/get_response_http_codes.sh
chmod u+x /opt/get_response_http_codes.sh
Разрешаем выполнение удаленных команд агенту Zabbix:
vi /etc/zabbix/zabbix_agentd.conf
EnableRemoteCommands=1После внесенных изменений, необходимо перезапустить агент Zabbix:
systemctl restart zabbix-agent
Далее создадим элемент данных в Zabbix:
| Key | Value |
|---|---|
| Name | HTTP Status Codes |
| Type | Zabbix agent |
| Key | system.run[sh /opt/get_response_http_codes.sh] |
| Type of Information | numeric (unsigned) |
| Update Interval | 1m |
Video Lecture


Description
Monitoring Log Files — HTTP Status Codes of a Nginx Proxy
If you don’t have an existing Nginx server that you can read the logs for, then you can install one.
Debian/Ubuntu
CentOS 8
The file I monitor is located at /var/log/nginx/access.log
The default Zabbix user that the Zabbix agent user uses, does not have read access to many log files on the system.
You can usually add the zabbix user to a group to solve this problem.
The nginx access.log file can be read by the www-data or adm groups on Ubuntu, so I add the Zabbix user to the adm group.
To find out which groups a log file can be read by, for example, I typed,
This tells me that the access.log file can be read by www-data and adm groups.
Then I check which groups the user Zabbix is part of,
If it’s not part of either group already, I then add it,
sudo usermod -a -G adm zabbix
and check again to confirm.
After changing the Zabbix users permissions, you will need to restart the Zabbix agent.
sudo service zabbix-agent restart
I can read the most recent log file entries by typing
tail -f /var/log/nginx/access.log
You can also check this command works when using the Zabbix user,
sudo -H -u zabbix bash -c 'tail -f /var/log/nginx/access.log'
I then created an item for the host, with settings
| Property | Value |
|---|---|
| Name | HTTP Status Codes |
| Type | Zabbix (active) |
| Key | log[/var/log/nginx/access.log,"^(S+) (S+) (S+) [([w:/]+s[+-]d{4})] "(S+)s?(S+)?s?(S+)?" (d{3}|-) (d+|-)s?"?([^"]*)"?s?"?([^"]*)"",,,skip,8,,,] |
| Type of Information | numeric (unsigned) |
| Update Interval | 1m |
The regex value that I copy into https://regex101.com is
^(S+) (S+) (S+) [([w:/]+s[+-]d{4})] "(S+)s?(S+)?s?(S+)?" (d{3}|-) (d+|-)s?"?([^"]*)"?s?"?([^"]*)"
This regex can separate the values for both Nginx and Apache access logs.
The regex splits each row of the log into several groups.
The HTTP Status code is in the 8th group.
I can also create triggers to notify on
- 101 Switching Protocols
- 301 Moved Permanently
- 302 Redirect
- 304 not modified
- 400 Bad Request
- 401 Unauthorized
- 403 Forbidden
- 404 Not found
- 405 Method Not Allowed
- 500 Server Error
In this video I demonstrate creating triggers for HTTP 5XX errors and use count to detect 10 or more HTTP 404 Errors in 10 minutes.
How and whether you decide to trigger on HTTP status codes is up to you.
The video just provides examples for you to follow.
Note
If you installed Zabbix like I did on Ubuntu 20.04 with the default Apache server, there also are Apache logs at /var/log/apache2/ on the Zabbix server that you can use for this lesson.
You can tail them in the command prompt using
tail -f /var/log/apache2/access.log
This is a good source of http logs of you don’t already have an active webserver somewhere that you can use, or you don’t want to set one up.
Apache and Nginx logs follow the same format so my regex in the video will still work.
Useful Links
Zabbix Agent Items
List of HTTP status codes
How to let the admin get noticed when 500 errors occurred in nginx?
asked Jan 21, 2010 at 5:12
![]()
ChengCheng
7212 gold badges9 silver badges16 bronze badges
3
maybe you could do something with a bash script, like
#!/bin/bash

b=`grep 'error' -c /var/log/nginx.log`

if [[ $b -gt 500 ]] ; then
echo "more than 500 errors";
# or send an email

else
#echo "OK" > /dev/null 2>&1

fi
answered Jan 21, 2010 at 10:05
![]()
RaziqueRazique
2,2661 gold badge19 silver badges23 bronze badges
3
Most monitoring systems, whether they’re software you install like Nagios or Zabbix or monitoring services such as Panopta or Pingdom, can be configured to detect 500 responses as errors and alert you to investigate. The benefit of using a full monitoring system is that you can get SMS or voice alerts in addition to just emails. You can also get notified if the server itself goes down or loses all connectivity, which a local cron script wouldn’t be able to handle.
answered Jan 21, 2010 at 23:32
![]()
Jason AbateJason Abate
4414 silver badges3 bronze badges
1
No matter you use scripts or monitoring systems.
You can used «curl» to check the http status code.
answered May 22, 2014 at 6:38
![]()
user164485user164485
511 silver badge6 bronze badges