I’m trying to make a heat plot for a discrete outcomes (each value uses a single color) such that:
df<-data.frame(x=rep(LETTERS[1:10], each=10),
               y=rep(1:10,10),
               value=sample(1:8, 100,replace=T))
colors<-c("green", "lightyellow", "yellow", "orange", "orangered", "red", "darkred", "black")
ggplot(df, aes(x=x, y=y))+
    geom_tile(aes(fill=value), colour="white")+
    #scale_fill_gradient(low="green", high="red")
    scale_fill_manual(values=colors)
Error: Continuous value supplied to discrete scale
Does somebody know how to fix it and apply the colors variable to the heatmap?
In this article, I’ll show how to handle the “Error: Continuous value supplied to discrete scale” in the R programming language.
The tutorial will consist of these topics:
Let’s dig in…
Exemplifying Data, Packages & Default Graph
In the first place, I’ll have to create some example data:
set.seed(834759)                                             # Create example data
data <- data.frame(x = rnorm(100),
                   group = 1:5)
head(data)                                                   # Head of example data
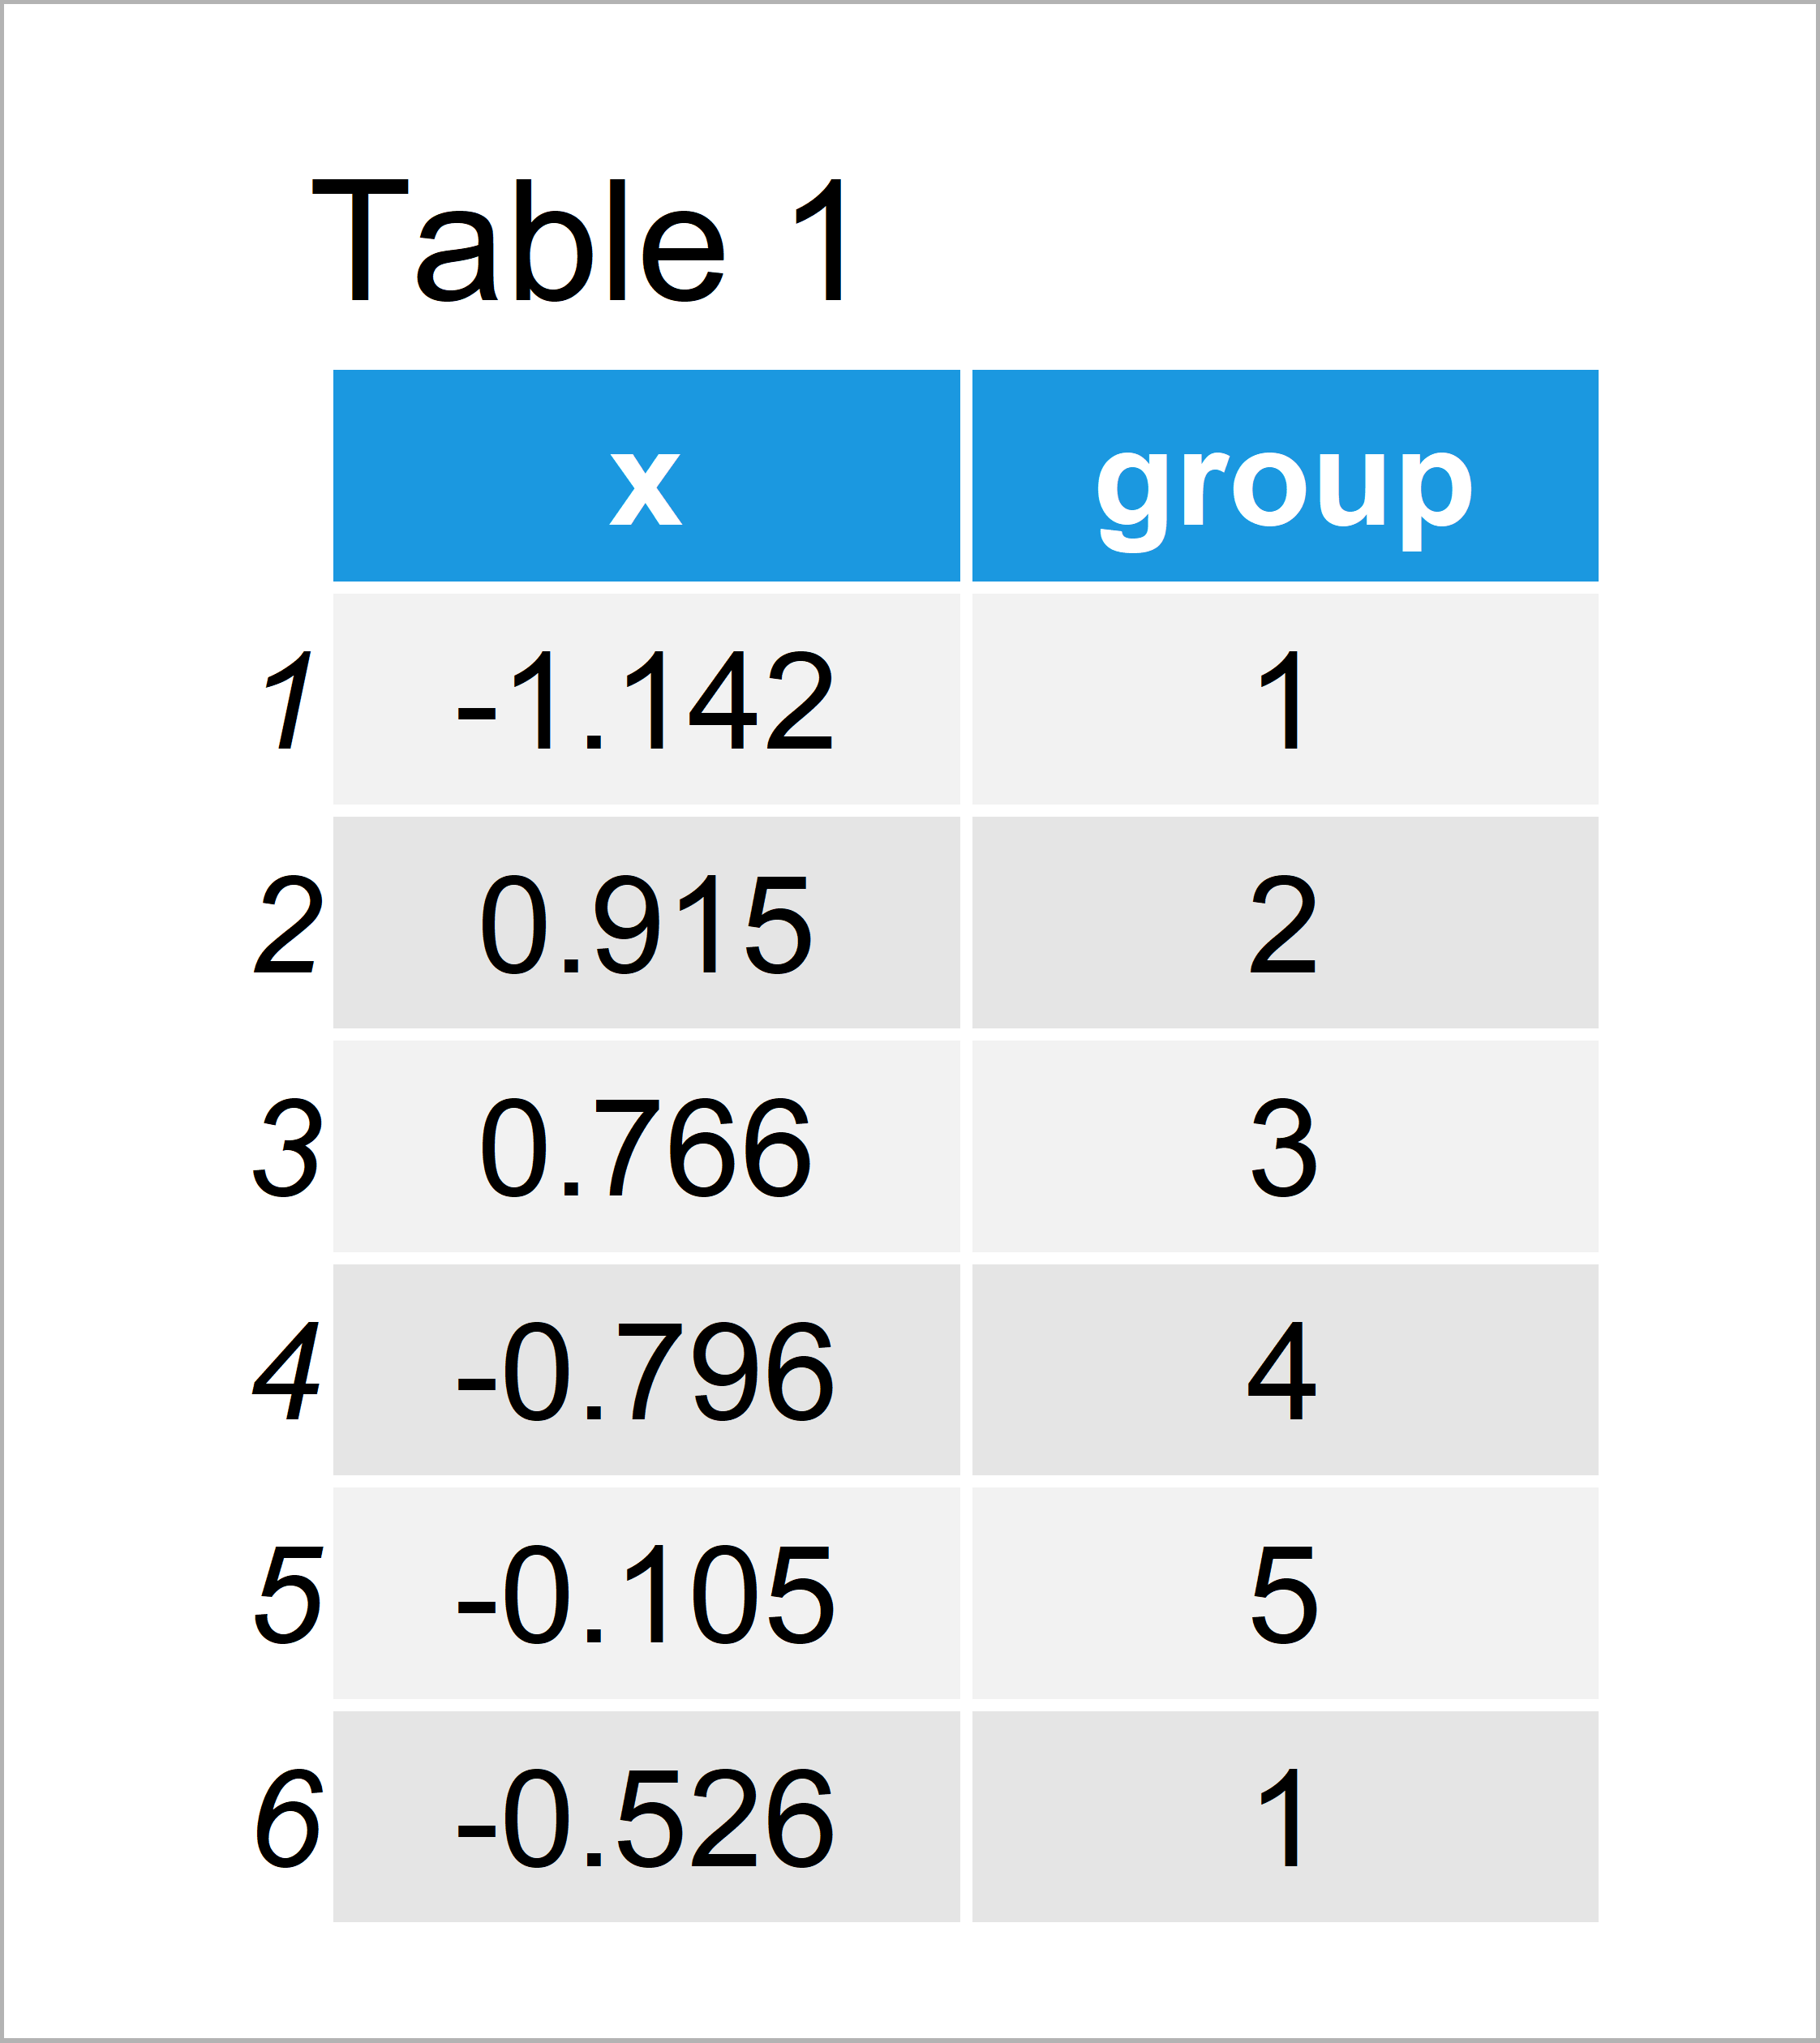
Table 1 shows the structure of our example data – It is constituted of 100 rows and two columns.
The variable x contains the values we want to display in a boxplot and the variable group defines the corresponding groups of our data.
We also need to install and load the ggplot2 package, in order to use the corresponding functions and commands:
install.packages("ggplot2")                                  # Install & load ggplot2 package
library("ggplot2")
Example 1: Reproduce the ggplot2 Error: Continuous value supplied to discrete scale
In this example, I’ll illustrate how to replicate the error message “Continuous value supplied to discrete scale” when drawing a graphic using the ggplot2 package in R.
Have a look at the following R code:
ggplot(data, aes(x, group = group, fill = group)) +          # Try to modify colors
  geom_boxplot() +
  scale_fill_manual(values = c("red", "yellow",
                               "blue", "orange",
                               "green"))
# Error: Continuous value supplied to discrete scale
As you can see, the RStudio console returns the “Error: Continuous value supplied to discrete scale” after executing the previous R syntax.
The reason for this is that our grouping variable has the numeric data class. However, to properly color the boxes of our groups, the grouping variable needs to be a factor.
So how can we solve this problem? Keep on reading!
Example 2: Fix the ggplot2 Error: Continuous value supplied to discrete scale
The following syntax shows how to avoid the “Error: Continuous value supplied to discrete scale”.
For this, we have to convert our grouping variable to the factor class using the factor() function.
Compare the last part of line one in the following code with the corresponding part in the previous example. As you can see, we are using the factor function to convert our grouping column from numeric to factor.
ggplot(data, aes(x, group = group, fill = factor(group))) +  # Properly adding colors
  geom_boxplot() +
  scale_fill_manual(values = c("red", "yellow",
                               "blue", "orange",
                               "green"))
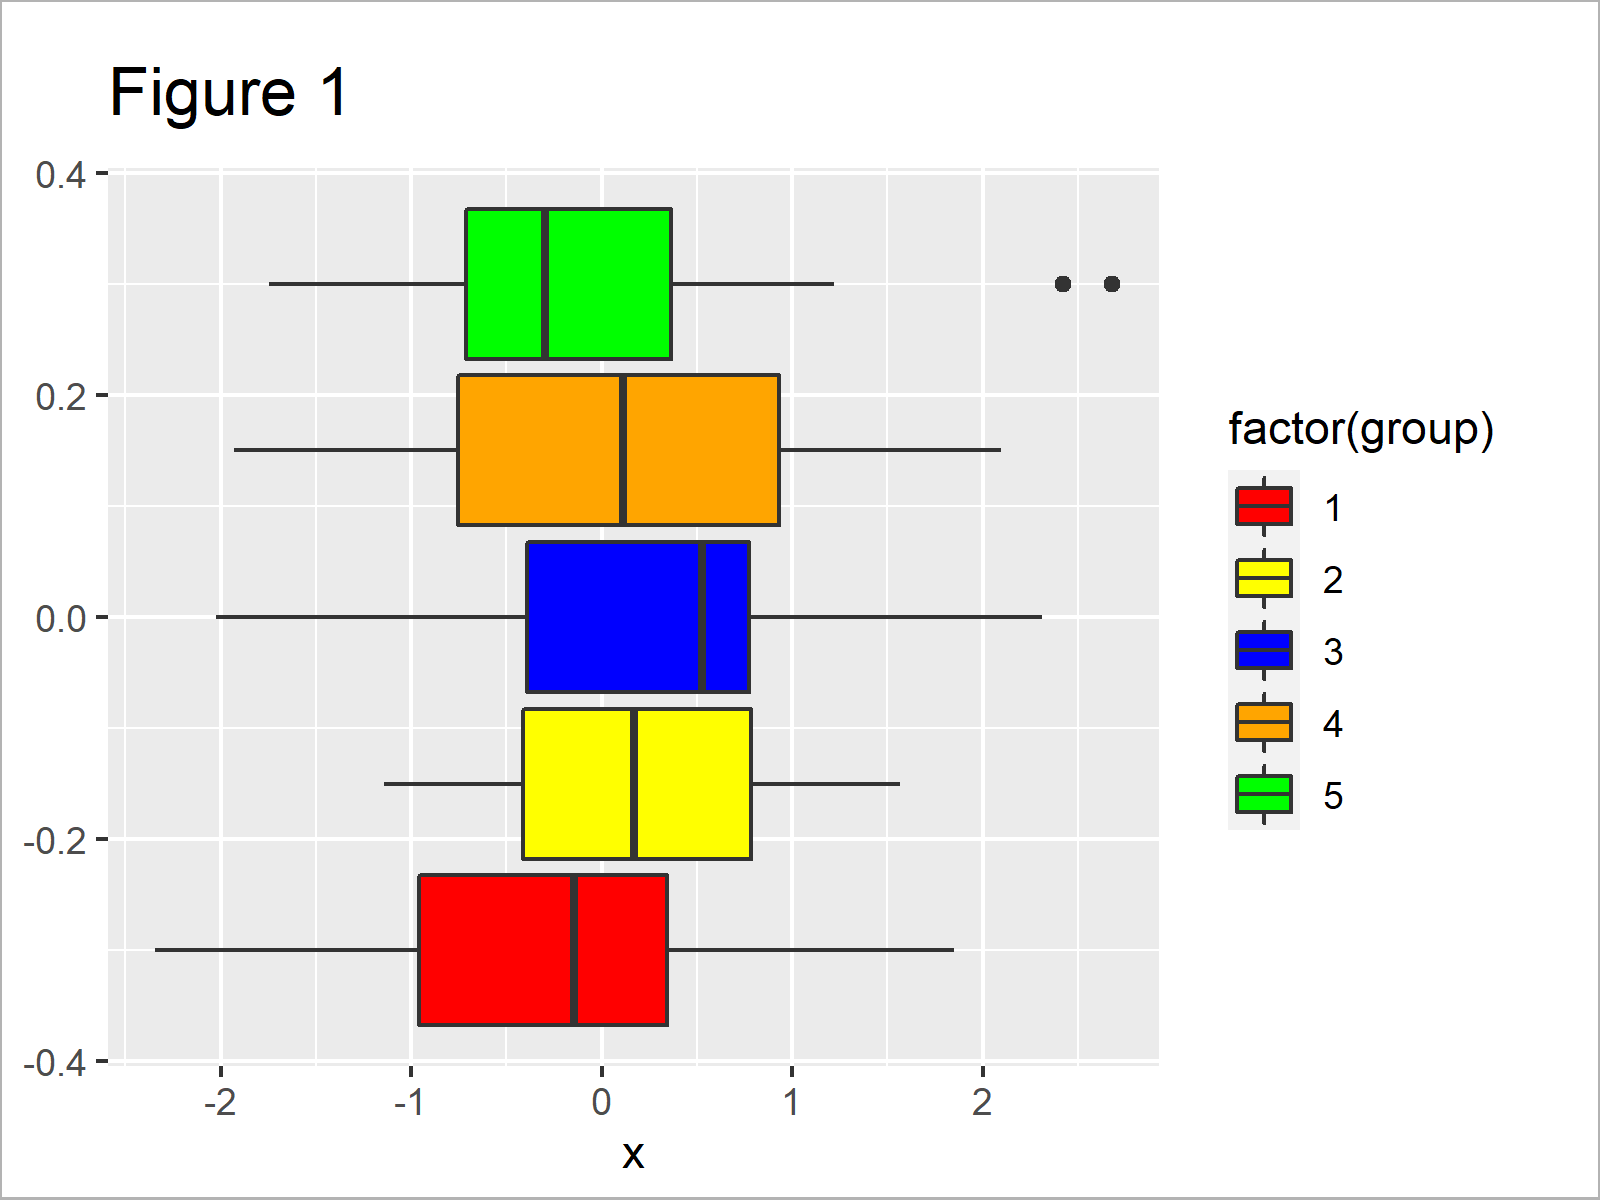
After executing the previous syntax the boxplot illustrated in Figure 1 has been created. As you can see, we have drawn each boxplot of our graphic in a different color.
Video & Further Resources
Do you need more information on the R programming syntax of this tutorial? Then I recommend having a look at the following video of my YouTube channel. I’m explaining the examples of this article in the video:
In addition, you might have a look at the other articles on this website. A selection of posts is shown below:
- ggplot2 Error: Discrete Value Supplied to Continuous Scale
- Error & Warning Messages in R
- R Programming Examples
In summary: You have learned in this article how to deal with the “Error: Continuous value supplied to discrete scale” in the R programming language. In case you have further questions, let me know in the comments. Furthermore, don’t forget to subscribe to my email newsletter for regular updates on the newest articles.
17 авг. 2022 г.
читать 2 мин
Одна ошибка, с которой вы можете столкнуться в R:
Error: Discrete value supplied to continuous scale
Эта ошибка возникает, когда вы пытаетесь применить непрерывную шкалу к оси в ggplot2, но переменная на этой оси не является числовой.
В этом руководстве рассказывается, как именно исправить эту ошибку.
Как воспроизвести ошибку
Предположим, у нас есть следующий фрейм данных в R:
#create data frame
df = data.frame(x = 1:12,
 y = rep(c('1', '2', '3', '4'), times= 3 ))

#view data frame
df

 x y
1 1 1
2 2 2
3 3 3
4 4 4
5 5 1
6 6 2
7 7 3
8 8 4
9 9 1
10 10 2
11 11 3
12 12 4
Теперь предположим, что мы пытаемся создать диаграмму рассеяния с пользовательским масштабом по оси Y, используя аргумент scale_y_continuous() :
library (ggplot2)

#attempt to create scatterplot with custom y-axis scale
ggplot(df, aes (x, y)) +
 geom_point() +
 scale_y_continuous(limits = c(0, 10))

Error: Discrete value supplied to continuous scale
Мы получаем ошибку, потому что наша переменная оси Y является символом, а не числовой переменной.
Мы можем подтвердить это, используя функцию class( ):
#check class of y variable
class(df$y)

[1] "character"
Как исправить ошибку
Самый простой способ исправить эту ошибку — преобразовать переменную оси Y в числовую переменную перед созданием диаграммы рассеяния:
library (ggplot2)

#convert y variable to numeric
df$y <- as.numeric(df$y)

#create scatterplot with custom y-axis scale
ggplot(df, aes (x, y)) +
 geom_point() +
 scale_y_continuous(limits = c(0, 10))
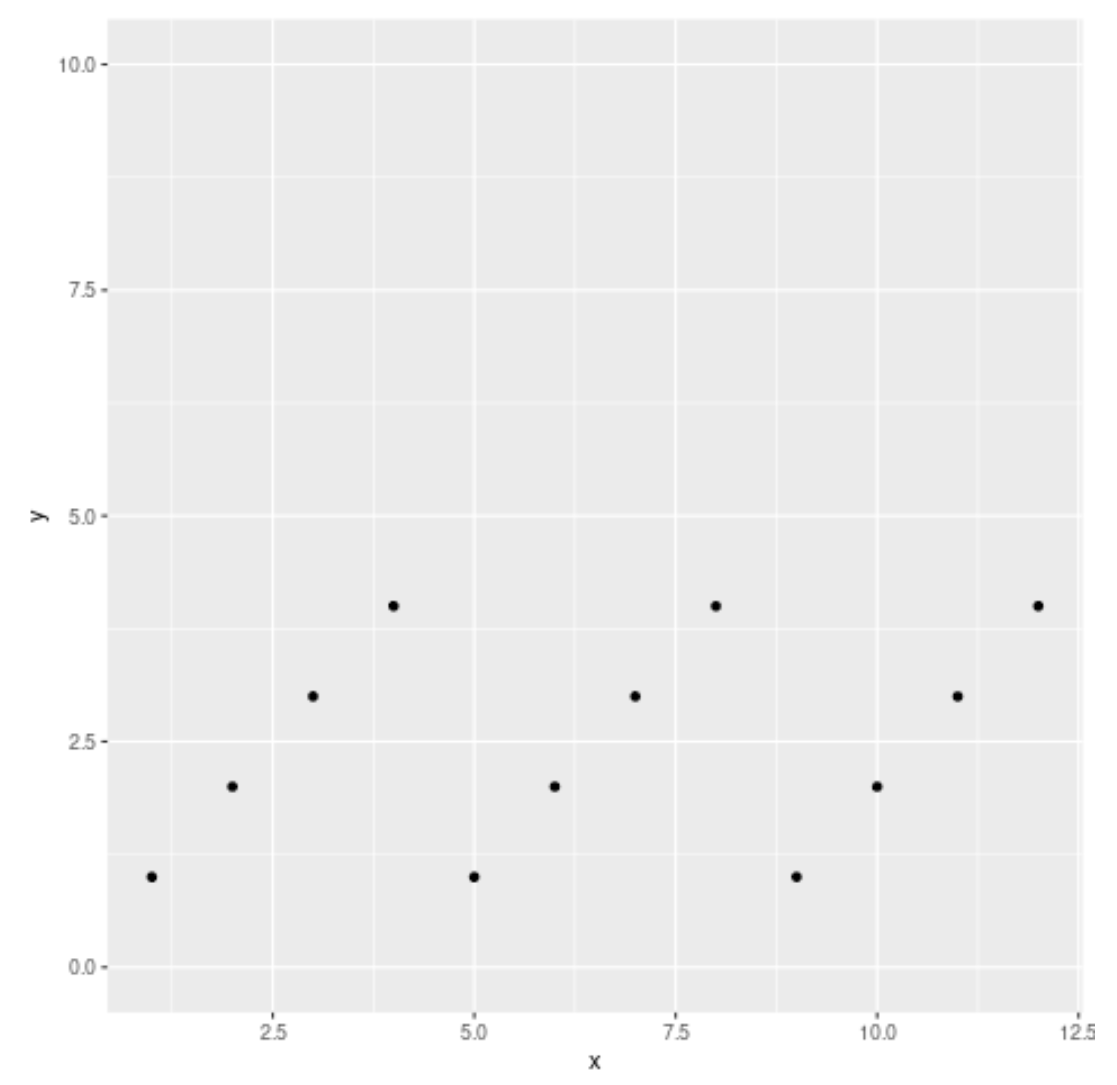
Обратите внимание, что мы не получили никакой ошибки, потому что мы использовали scale_y_continuous() с числовой переменной вместо символьной.
Вы можете найти полную онлайн-документацию для функции scale_y_continuous() здесь .
Дополнительные ресурсы
В следующих руководствах объясняется, как выполнять другие распространенные функции построения графиков в ggplot2:
Как установить разрывы осей в ggplot2
Как удалить метки осей в ggplot2
Как повернуть метки осей в ggplot2
Hey there, fellow R enthusiasts! Have you ever tried to create a plot in R, only to be met with a cryptic error message that says “Discrete value supplied to continuous scale”? Don’t worry, you’re not alone! This error message can be frustrating and confusing, but fear not – we’re here to help you understand what it means and how to fix it. In this article, we’ll explore the common causes of the “Discrete value supplied to continuous scale” error message and provide some tips and tricks for resolving it.
When Does This Error Happen?
The “discrete value supplied to continuous scale” message occurs when using the ggplot() function along with the scale__continuous()scale function to specify a specific scale for a graph.
# this error is related to the ggplot2 library, so we need to load it (if you haven't already)
install.packages("ggplot2")
library("ggplot2")

# r error discrete value supplied to continuous scale
> a = data.frame(x = 1:10, y = c("cat", "dog", "bat", "cow", "rat"))
> ggplot(a, aes(x, y)) + geom_point()
In this example of the basic usage of ggplot(), the scale function is not used. However, it does produce a successful graph of the data frame. Getting this message requires including the scale function and doing so incorrectly. That turns out to be the key to fixing the continuous variable problem and that is using the scale function correctly.
What Caused The Error?
The “discrete value supplied to continuous scale” message is caused by erroneous use of the scale function along with ggplot().
# discrete value supplied to continuous scale r error
> a = data.frame(x = 1:10, y = c("cat", "dog", "bat", "cow", "rat"))
> ggplot(a, aes(x, y)) + geom_point() + scale_y_continuous(limits = c(0, 15))
Error: Discrete value supplied to continuous scale
The mistake in this example that leads to the error message is trying to create a continuous scale for the “y” axis. The problem is that the “y” vector is a discrete variable consisting of words, i.e. a character vector or categorical variable, not a numeric vector, which would create continuous data. This means that you are trying to create a continuous value for a discrete value axis. It does not work resulting in our message.
The “discrete value supplied to continuous scale” message can be fixed but making sure that at least one of the position scales in the data frame is a continuous value rather than a discrete scale and applying the scale function to that character vector to make it a numeric vector.
# discrete value supplied to continuous scale solution
> a = data.frame(x = 1:10, y = c("cat", "dog", "bat", "cow", "rat"))
> ggplot(a, aes(x, y)) + geom_point() + scale_x_continuous(limits = c(0, 15))
As you can see from this example using “x” instead of “y” in the scale function fixes the problem by supplying a numeric value list instead of characters. This factor makes all the difference.
# discrete value continuous scale r solution
> a = data.frame(x = 1:10, y = c(1:5))
> ggplot(a, aes(x, y)) + geom_point() + scale_y_continuous(limits = c(0, 7))
The other option as seen above is to turn “y” into a numeric list as illustrated above. The one problem with this solution is that the dataset graph, scatter plot, box plot, or bar chart is losing some of its meaning. This is because the model no longer has the categorical variable labels that it previously did.
A Deeper Look at Potential Causes of the Error
The “Discrete value supplied to continuous scale” error message is a common issue that can occur when creating plots in R. This error message indicates that there is a mismatch between the data type or scale type of a variable and the plotting function used to create the plot. There are several potential causes of this error message, including using a continuous scale when the data is discrete, using the wrong data type for a variable, and inconsistent data formatting. By understanding these potential causes, you can more easily diagnose and resolve the “Discrete value supplied to continuous scale” error message in R.
Here are some potential causes of the “Discrete value supplied to continuous scale” error message in R:
- Using a continuous scale when the data is discrete:
- If the data is categorical or discrete, such as a factor or character variable, it should be plotted using a discrete scale, such as a factor or date scale. Using a continuous scale, such as a numeric or date-time scale, can result in the “Discrete value supplied to continuous scale” error message.
- Using the wrong data type for a variable:
- Simple enough – if there’s a mismatch between the data type and the scale, you’ll get an error message.
- Mismatched data types between variables:
- Similar to error #2 – if you’re trying to plot different variables in a multi-variable plot on the same scale, you’ll get an error.
- Inconsistent data formatting:
- Formatting variances can throw the code off…
- Using the wrong plotting function:
- The function needs to match the data type you’re trying to plot.
By understanding these potential causes of the “Discrete value supplied to continuous scale” error message in R, you can more easily diagnose and resolve the issue when it occurs.
Strategies for Resolving the Error
If you encounter the “Discrete value supplied to continuous scale” error message in R, there are several strategies you can use to resolve the issue. Here are some options to consider:
- Converting discrete data to a factor or character type:
- If the data is discrete convert it to the appropriate data type using the
as.factor()oras.character()functions, respectively.
- If the data is discrete convert it to the appropriate data type using the
- Changing the scale type to a discrete scale, such as a factor or date scale:
- Using the appropriate plotting function for the data type:
By using these strategies, you can effectively resolve the “Discrete value supplied to continuous scale” error message in R and create accurate and informative plots.
Summation
The “discrete value supplied to continuous scale” error message is more of a minor nuisance than a serious problem. It is simply a matter of using the wrong vector from the data frame. Correcting that one continuous data mistake in your plotting code solves the problem in a simple and easy manner.
R Error: discrete value supplied to continuous scale
This error occurs if you use a numeric variable for the fill, color, and shape aesthetics in ggplot when it expects a factor variable. You can solve this error by using a factor class variable as the grouping variable. You can convert numeric values to factor using the factor() function.
This tutorial will go through the error in detail and how to solve it with code examples.
Table of contents
- Example
- Solution: Use factor() To convert numerical values to factor
- Example #2: Default data set example mtcars and ggplot2
- Solution
- Summary
Example
Consider a dataset consisting of 500 random values sampled from the normal distribution. Each of the samples falls into one of five catogories.
set.seed(0)
df <- data.frame(x = rnorm(500), category= 1:5)
head(df)
Let’s run the code to see the data frame:
   x category
1  1.2629543        1
2 -0.3262334        2
3  1.3297993        3
4  1.2724293        4
5  0.4146414        5
6 -1.5399500        1
Next, we will attempt to create five box plots to show the distribution of the values within the five data groups.
library("ggplot2")

ggplot(df, aes(x, group = category, fill = category)) +
  geom_boxplot() +
  scale_fill_manual(values = c("magenta", "steelblue",
                               "blue", "purple",
                               "yellow"))
Let’s run the code to see what happens:
Error: Continuous value supplied to discrete scale
The error occurs because the fill argument in the aes() function call expects a factor variable not numeric. We can verify that category is numeric using is.numeric():
is.numeric(df$category)
[1] TRUE
Solution: Use factor() To convert numerical values to factor
We can solve this error by converting the category variable to a factor using the built-in factor function. Let’s look at the revised code:
library("ggplot2")

ggplot(df, aes(x, group = category, fill = factor(category))) +
  geom_boxplot() +
  scale_fill_manual(values = c("magenta", "steelblue",
                               "blue", "purple",
                               "yellow"))
Let’s run the code to get the result:
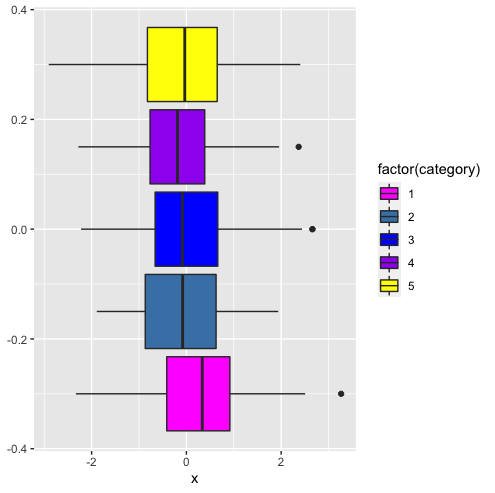
We successfully plotted the five box plots.
Example #2: Default data set example mtcars and ggplot2
Let’s look at an example of plotting three variables from the mtcars dataset. We will attempt to plot miles-per-gallon (mpg) against weight (wt) with the number of cylinders (cyl) as the colour and shape of the points. We will also plot lines of best fit for the three cyl categories (4, 6, 8).
ggplot(mtcars, aes(x=wt, y=mpg, color=cyl, shape=cyl)) +
  geom_point() +
  geom_smooth(method=lm, se=FALSE, fullrange=TRUE)+
  scale_shape_manual(values=c(3, 16, 17))+
  scale_color_manual(values=c('#999999','#E69F00', '#56B4E9'))+
  theme(legend.position="top")
Let’s run the code to see what happens:
Error: Continuous value supplied to discrete scale
The error occurs because the color and shape arguments in the aes() function call need to be factors not numeric.
Solution
We can solve this error by converting cyl from numeric to factor using the factor() function. Let’s look at the revised code:
ggplot(mtcars, aes(x=wt, y=mpg, color=factor(cyl), shape=factor(cyl))) +
  geom_point() +
  geom_smooth(method=lm, se=FALSE, fullrange=TRUE)+
  scale_shape_manual(values=c(3, 16, 17))+
  scale_color_manual(values=c('#999999','#E69F00', '#56B4E9'))+
  theme(legend.position="top")
Let’s run the code to get the result:
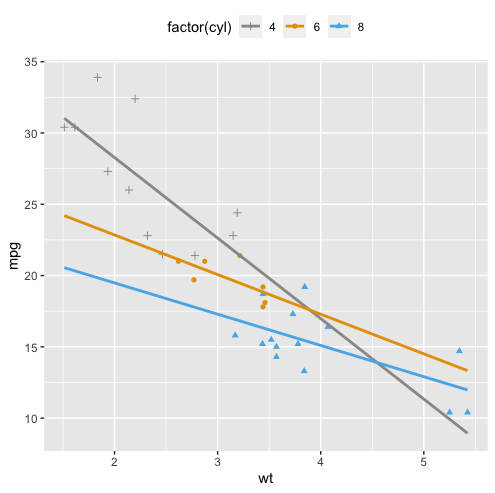
We successfully created the plot.
Summary
Congratulations on reading to the end of this tutorial!
For further reading on R related errors, go to the articles:
- How to Solve R Error: Discrete Value Supplied to Continuous Scale
- How to Solve R Error: plot.window(…): need finite ‘ylim’ values
- How to Solve R Error in file(file, “rt”) cannot open the connection
- How to Solve R error in aggregate.data.frame(as.data.frame(x), …) : arguments must have same length
Go to the online courses page on R to learn more about coding in R for data science and machine learning.
Have fun and happy researching!

