
«Segmentation fault» means that you tried to access memory that you do not have access to.
The first problem is with your arguments of main. The main function should be int main(int argc, char *argv[]), and you should check that argc is at least 2 before accessing argv[1].
Also, since you’re passing in a float to printf (which, by the way, gets converted to a double when passing to printf), you should use the %f format specifier. The %s format specifier is for strings (''-terminated character arrays).
Programming languages like C and C++ manage the memory in a more direct way than other programming languages like Java, C#, Python, etc. When an application tries to access the memory area that it does not belong to it Segmentation Fault occurs. Generally, the segmentation fault resulted in the core being dumped which is saving the error memory area into a file for later investigation. There are different reasons for the “Segmentation Fault”/”Core Dumped” error like below.
- Modifying String Literal
- Accessing Freed Address
- Accessing Out Of Array Index Bounds
- Improper useof scanf() Function
- Stackoverflow
- Dereferencing Uninitialized Pointer
Modifying String Literal
String literals are stored in a read-only part of the application. String literals can not be edited as they are located in the read-only part of memory. When the string literal is tried to be changed the segmentation fault occurs and the core is dumped with the Abnormal termination of program .
int main()
{
   char *s;

   /* Stored in read only part of application memory */
   s = "wt";

   /* Problem: trying to modify read only memory */
   *(s+1) = 'x';

   return 0;
}
Accessing Freed Address
Pointers are used to allocated memory parts with memory addresses. After usage, the memory areas or addresses are freed and the freed address range can not be used. If the application tries to access the free address locations the “core dump” error occurs.
int main()
{
   char* s= (int*) malloc(8*sizeof(int));

   *s = 10;

   //s memory area is freed
   free(s);

   //Try to access free memory are
   *s = 20;

   return 0;
}
Accessing Out Of Array Index Bounds
C and C++ programming languages provide arrays in order to store multiple characters and values inside a single variable. The size of the arrays should be set during initialization and the memory area is allocated according to its size. If the application tries to access of range memory area of the array the “core dump” error occurs.
int main()
{
   char s[3]="abc";

   s[5]="d";

   return 0;
}
Improper useof scanf() Function
The scanf() function is used to read user input from the standard input interactively. The scanf() function requires the memory address of a variable in order to store read value If the address is not provided properly or read-only.
int main()
{
   char s[3];

   scanf("%s",&s+1)

   return 0;
}
StackOverflow
Every application has a limited memory area called the stack. The stack area is used to store data temporarily during the execution of the application when functions are called. When the stack area is filled and there is no free area the StackOverflow occurs. The stack overflow generally occurs in error-prone algorithms like using recursive functions infinitely.
int main()
{
    rec();
}

int rec()
{
   int a = 5;

   rec();
}
Dereferencing Uninitialized Pointer
Pointers are used to point to specific memory addresses. In order to use a pointer, it should be initialized before accessing or dereferencing it. Without initialization, the pointer does not point to any memory area or data which can not be used.
int main()
{
   int* a;

   printf("%d",*a);

   return 0;
}Segmentation faults in C or C++ is an error that occurs when a program attempts to access a memory location it does not have permission to access. Generally, this error occurs when memory access is violated and is a type of general protection fault. Segfaults are the abbreviation for segmentation faults.
The core dump refers to the recording of the state of the program, i.e. its resources in memory and processor. Trying to access non-existent memory or memory which is being used by other processes also causes the Segmentation Fault which leads to a core dump.
A program has access to specific regions of memory while it is running. First, the stack is used to hold the local variables for each function. Moreover, it might have memory allocated at runtime and saved on the heap (new in C++ and you may also hear it called the “free store“). The only memory that the program is permitted to access is it’s own (the memory previously mentioned). A segmentation fault will result from any access outside of that region.
Segmentation fault is a specific kind of error caused by accessing memory that “does not belong to you“:
- When a piece of code tries to do a read-and-write operation in a read-only location in memory or freed block of memory, it is known as a segmentation fault.
- It is an error indicating memory corruption.
Common Segmentation Fault Scenarios
In a Segmentation fault, a program tries to access memory that is not authorized to access, or that does not exist. Some common scenarios that can cause segmentation faults are:
- Modifying a string literal
- Accessing an address that is freed
- Accessing out-of-array index bounds
- Improper use of scanf()
- Stack Overflow
- Dereferencing uninitialized pointer
1. Modifying a String Literal
The string literals are stored in the read-only section of the memory. That is why the below program may crash (gives segmentation fault error) because the line *(str+1) = ‘n’ tries to write a read-only memory.
Example:
C
#include <stdio.h>
int main()
{
char* str;
str = "GfG";
*(str + 1) = 'n';
return 0;
}
C++
#include <iostream>
using namespace std;
int main()
{
char* str;
str = "GfG";
*(str + 1) = 'n';
return 0;
}
Output
timeout: the monitored command dumped core
/bin/bash: line 1: 32 Segmentation fault timeout 15s ./83b16132-8565-4cb1-aedb-4eb593442235 < 83b16132-8565-4cb1-aedb-4eb593442235.in
Refer, to Storage for Strings in C for more details.
2. Accessing an Address That is Freed
Here in the below code, the pointer p is dereferenced after freeing the memory block, which is not allowed by the compiler. Such pointers are called dangling pointers and they produce segment faults or abnormal program termination at runtime.
Example:
C
#include <stdio.h>
#include <stdlib.h>
int main(void)
{
int* p = (int*)malloc(8);
*p = 100;
free(p);
*p = 110;
printf("%d", *p);
return 0;
}
C++
#include <iostream>
using namespace std;
int main(void)
{
int* p = (int*)malloc(sizeof(int));
*p = 100;
free(p);
*p = 110;
return 0;
}
Output
Segmentation Fault
3. Accessing out-of-bounds Array Index
In C and C++, accessing an out-of-bounds array index may cause a segmentation fault or other undefined behavior. There is no boundary checking for arrays in C and C++. Although in C++, the use of containers such as with the std::vector::at() method or with an if() statement, can prevent out-of-bound errors.
Example:
C
#include <stdio.h>
int main(void)
{
int arr[2];
arr[3] = 10;
return (0);
}
C++
#include <iostream>
using namespace std;
int main()
{
int arr[2];
arr[3] = 10;
return 0;
}
Output
Segmentation Faults
4. Improper use of scanf()
The scanf() function expects the address of a variable as an input. Here in this program n takes a value of 2 and assumes its address as 1000. If we pass n to scanf(), input fetched from STDIN is placed in invalid memory 2 which should be 1000 instead. This causes memory corruption leading to a Segmentation fault.
Example:
C
#include <stdio.h>
int main()
{
int n = 2;
scanf("%d", n);
return 0;
}
C++
#include <iostream>
using namespace std;
int main()
{
int n = 2;
cin >> n;
return 0;
}
Output
Segementation Fault
5. Stack Overflow
It’s not a pointer-related problem even code may not have a single pointer. It’s because of running out of memory on the stack. It is also a type of memory corruption that may happen due to large array size, a large number of recursive calls, lots of local variables, etc.
Example:
C
#include <stdio.h>
int main()
{
int arr[2000000000];
return 0;
}
C++
#include <iostream>
using namespace std;
int main()
{
int array[2000000000];
return 0;
}
Output
Segmentation Fault
6. Buffer Overflow
If the data being stored in the buffer is larger than the allocated size of the buffer, a buffer overflow occurs which leads to the segmentation fault. Most of the methods in the C language do not perform bound checking, so buffer overflow happens frequently when we forget to allot the required size to the buffer.
Example:
C
#include <stdio.h>
int main()
{
char ref[20] = "This is a long string";
char buf[10];
sscanf(ref, "%s", buf);
return 0;
}
C++
#include <iostream>
using namespace std;
int main()
{
char ref[20] = "This is a long string";
char buf[10];
sscanf(ref, "%s", buf);
return 0;
}
Output
Segmentation Fault
7. Dereferencing an Uninitialized or NULL Pointer
It is a common programming error to dereference an uninitialized pointer (wild pointer), which can result in undefined behavior. When a pointer is used in a context that treats it as a valid pointer and accesses its underlying value, even though it has not been initialized to point to a valid memory location, this error occurs. Data corruption, program errors, or segmentation faults can result from this. Depending on their environment and state when dereferencing, uninitialized pointers may yield different results.
As we know the NULL pointer does not points to any memory location, so dereferencing it will result in a segmentation fault.
Example:
C
#include <stdio.h>
int main()
{
int* ptr;
int* nptr = NULL;
printf("%d %d", *ptr, *nptr);
return 0;
}
C++
#include <iostream>
using namespace std;
int main()
{
int* ptr;
int* nptr = NULL;
cout << *ptr << " " << *nptr;
return 0;
}
Output
Segmentation Fault
How to Fix Segmentation Faults?
We can fix segmentation faults by being careful about the causes mentioned:
- Avoid modifying string literals.
- Being careful when using pointers as they are one of the most common causes.
- Considering the buffer and stack size before storing the data to avoid buffer or stack overflow.
- Checking for bounds before accessing array elements.
- Use scanf() and printf() carefully to avoid incorrect format specifiers or buffer overflow.
Overall, the cause of the segmentation fault is accessing the memory that does not belong to you in that space. As long as we avoid doing that, we can avoid the segmentation fault. If you cannot find the source of the error even after doing it, it is recommended to use a debugger as it directly leads to the point of error in the program.
Last Updated :
07 May, 2023
Like Article
Save Article
In Linux, the error “segmentation fault (core dumped)” comes across during the execution of the script file (C, C++, Python, Java) from the terminal. The core dump is when a code performs read and write operations on a free memory location.
This article will provide multiple solutions to the above-stated “segmentation fault (core dumped)” error. The supported content of this guideline is as follows:
- Reason: Attempting the Non-Existing Memory
- Solution 1: Remove the Lock File
- Solution 2: Kill the Specific Process
Reason: Attempting the Non-Existing Memory
The main cause of this error is that you are trying to access a specific portion of memory that does not exist. For instance, when users try to read or write the elements of a non-existent array, do not define the pointer before using it or use a memory address with the same variable value. Therefore, the particular program will crash and display the “segmentation fault” error when executing the file:
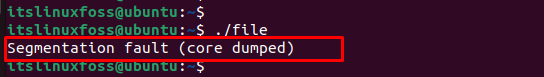
The next sections contain several solutions to encounter the above error.
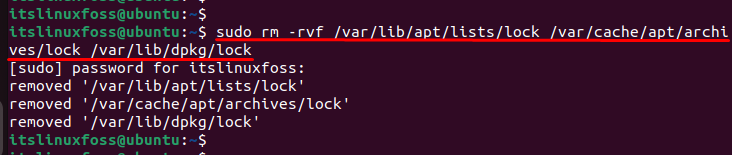
Solution 1: Remove the Lock File
During the execution of a program, locked files are created to make the script files executable. To resolve the error, one of the solutions is to remove the lock file that attempts the non-existent memory. For removing these files, the “rm” command is used to delete the lock files:
$ sudo rm -rvf /var/lib/apt/lists/lock /var/cache/apt/archives/lock /var/lib/dpkg/lock
Let’s head over to another solution.
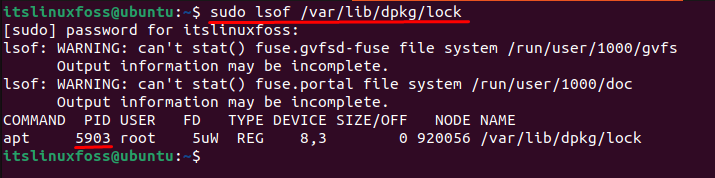
Solution 2: Kill the Specific Process
Users can consider another solution to resolve errors by killing the specific process. First, locate the process id stored in the “/var/lib/dpkg/lock” directory:
$ sudo lsof /var/lib/dpkg/lock
After identifying the specific process id, you can go to terminate the process. For this, the “kill” command is utilized with a “-9” signal that forcefully terminates the running process “5903”:
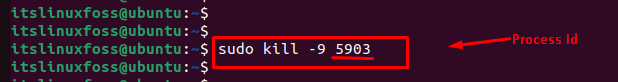
You can verify that the “kill” command terminates the specific process via “5903” id.
Conclusion
In Linux, the error “segmentation fault (core dumped)” occurs when the process requires additional memory that the operating system does not permit access. It can be resolved by removing the “lock” files through the “rm” command, clearing the cache repository, or killing the process via “process id”. This article has explained all possible solutions to encounter the error mentioned above.
The core file is normally called core and is located in the current working directory of the process. However, there is a long list of reasons why a core file would not be generated, and it may be located somewhere else entirely, under a different name. See the core.5 man page for details:
DESCRIPTION
The default action of certain signals is to cause a process to
terminate and produce a core dump file, a disk file containing an
image of the process’s memory at the time of termination. This image
can be used in a debugger (e.g., gdb(1)) to inspect the state of the
program at the time that it terminated. A list of the signals which
cause a process to dump core can be found in signal(7).…
There are various circumstances in which a core dump file is not produced:
   *  The process does not have permission to write the core file.  (By
      default, the core file is called core or core.pid, where pid is
      the ID of the process that dumped core, and is created in the
      current working directory.  See below for details on naming.)
      Writing the core file will fail if the directory in which it is to
      be created is nonwritable, or if a file with the same name exists
      and is not writable or is not a regular file (e.g., it is a
      directory or a symbolic link).
   *  A (writable, regular) file with the same name as would be used for
      the core dump already exists, but there is more than one hard link
      to that file.
   *  The filesystem where the core dump file would be created is full;
      or has run out of inodes; or is mounted read-only; or the user has
      reached their quota for the filesystem.
   *  The directory in which the core dump file is to be created does
      not exist.
   *  The RLIMIT_CORE (core file size) or RLIMIT_FSIZE (file size)
      resource limits for the process are set to zero; see getrlimit(2)
      and the documentation of the shell's ulimit command (limit in
      csh(1)).
   *  The binary being executed by the process does not have read
      permission enabled.
   *  The process is executing a set-user-ID (set-group-ID) program that
      is owned by a user (group) other than the real user (group) ID of
      the process, or the process is executing a program that has file
      capabilities (see capabilities(7)).  (However, see the description
      of the prctl(2) PR_SET_DUMPABLE operation, and the description of
      the /proc/sys/fs/suid_dumpable file in proc(5).)
   *  (Since Linux 3.7) The kernel was configured without the
      CONFIG_COREDUMP option.
In addition, a core dump may exclude part of the address space of the
process if the madvise(2) MADV_DONTDUMP flag was employed.Naming of core dump files
By default, a core dump file is named core, but the
/proc/sys/kernel/core_pattern file (since Linux 2.6 and 2.4.21) can
be set to define a template that is used to name core dump files.
The template can contain % specifiers which are substituted by the
following values when a core file is created:%% a single % character %c core file size soft resource limit of crashing process (since Linux 2.6.24) %d dump mode—same as value returned by prctl(2) PR_GET_DUMPABLE (since Linux 3.7) %e executable filename (without path prefix) %E pathname of executable, with slashes ('/') replaced by exclamation marks ('!') (since Linux 3.0). %g (numeric) real GID of dumped process %h hostname (same as nodename returned by uname(2)) %i TID of thread that triggered core dump, as seen in the PID namespace in which the thread resides (since Linux 3.18) %I TID of thread that triggered core dump, as seen in the initial PID namespace (since Linux 3.18) %p PID of dumped process, as seen in the PID namespace in which the process resides %P PID of dumped process, as seen in the initial PID namespace (since Linux 3.12) %s number of signal causing dump %t time of dump, expressed as seconds since the Epoch, 1970-01-01 00:00:00 +0000 (UTC) %u (numeric) real UID of dumped process
Вводная
C является «небезопасным» («unmanaged») языком, поэтому программы могут «вылетать» — аварийно завершать работу без сохранения данных пользователя, сообщения об ошибке и т.п. — стоит только, например, залезть в не инициализированную память. Например:
void fall()
{
  char * s = "short_text";
  sprintf(s,"This is very long text");
}
или
void fall()
{
  int * pointer = NULL;
  *pointer = 13;
}
Всем было бы лучше, если бы мы могли «отловить» падение программы — точно так же, как в java ловим исключения — и выполнить хоть что-то перед тем, как программа упадет (сохранить документ пользователя, вывести диалог с сообщением об ошибке и т.п.)
Общего решения задача не имеет, так как C не имеет собственной модели обработки исключений, связанных с работой с памятью. Тем не менее, мы рассмотрим два способа, использующих особенности операционной системы, вызвавшей исключение.
Есть 2 класса:
1) UI
//UI.h
#ifndef UI_H
#define UI_H
#include <map>
#include <string>
#include <FL/Fl_Button.H>
#include <FL/Fl_Window.H>
#include <FL/Fl_Box.H>
#include <FL/Fl_Output.H>
#include <FL/Fl_Widget.H>
using namespace std;

class App;
class Calculator;

class UI {
public:
    Fl_Window *flWindow;
    map< string, Fl_Box* > flBox;
    map< string, Fl_Button*> flButtons;

    Fl_Output *output;
    App *app;
    Calculator *calc;

    UI(App* app);
    void startWindow();
    void endWindow();
    void createUI();

    static void resetOutputCb(Fl_Widget *w, void *data);

    void changeOutputValue();
    void prepareOutput(string& insertedValue, bool isNewAction);
};
#endif /* UI_H */
2) Calculator:
//Calculator.h
#ifndef CALCULATOR_H
#define CALCULATOR_H
#include <string>
#include <FL/Fl_Widget.H>
using namespace std;

class UI;

class Calculator {
public:
    Calculator(UI *ui);
    UI *ui;

    string leftOperand;
    string action;
    string rightOperand;

    static void clickButtonCb(Fl_Widget *w, void *data);
    bool isNewAction(string action);
private:
    void makeCalc(bool isNewValue);
    double plus(double x, double y);
};

#endif /* CALCULATOR_H */
Класс UI инициализирует класс Calсulator и передает ему указатель на самого себя:
UI::UI(App *app) {
    this->app = app;
    this->calc = new Calculator(this);
}
Класс Calculator в свою очередь записывает указатель на UI в одно из своих свойств:
Calculator::Calculator(UI *ui) :
leftOperand("0"),
rightOperand(""),
action("") {
    this->ui = ui;
}
}
Однако теперь при попытке вызвать из Calculator метод класса UI:
void UI::prepareOutput(string& insertedValue, bool isNewAction) {
    if (calc->action != "" && !isNewAction) { // странно, что при calc->action != "" ошибки нет
        if (calc->rightOperand == "0") {
            calc->rightOperand = "";
        }
        calc->rightOperand  = insertedValue; // НО ВОТ ТУТ Возникает ошибка при работе с calc->rightOperand
    } else if (!isNewAction) {
        if (calc->leftOperand == "0") {
            calc->leftOperand = "";
        }
        calc->leftOperand  = insertedValue;
    }
    if (isNewAction && calc->rightOperand == "" && calc->action != "" && insertedValue != "=") {
        calc->action = insertedValue;
    }
}
возникает ошибка:
Segmentation fault; core dumped;
Такая же возникает ошибка, если в классе Calculator сделать что-то вроде :
string str = this->ui->calc->leftOperand; // Segmentation fault; core dumpedПри дебаге в переменных видны “странные” для меня значения, ведь ожидаются простые строки: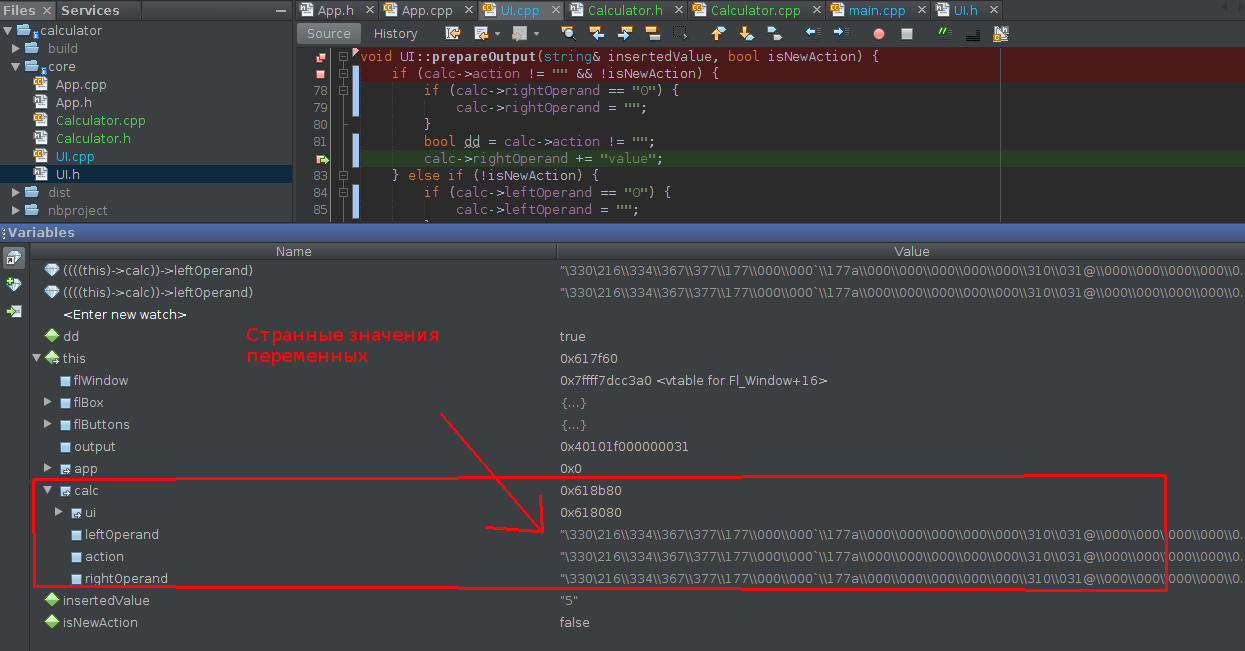
Почему возникает эта ошибка и как ее исправить?
Не запускается сервер
Ошибка segmentation fault (core dumped)
Есть данный код на СИ, суть в том, чтобы в двумерном массиве с помощью потоков (Linux) найти самую большую последовательность чисел по возрастанию. При компиляции всё хорошо, а как запускаю программу появляется ошибка Segmentation fault (core dumped)
#include <unistd.h>
#include <stdio.h>
#include <pthread.h>
#include <stdlib.h>
#include <sys/types.h>
#include <time.h>


void random1(int arr[5][100]) {
int i,j;
for(i=0; i<5;i  )
{
for(j=0; j<100;j  )
{
arr[i][j]=rand()0;
printf("%dt", arr[i][j]);
}
printf("n");
}
printf("n");
}

void* thread_func1(int arr[5][100]){

int buffer = 1, maxbuffer=0, max=0, minElement=0, maxElement;
int i,j;
for(i=0;i<5;i  )
{
for(j=0;j<100;j  )
{
if(arr[i][j 1]>arr[i][j])
{
buffer  ;
max=buffer;
if(maxbuffer<max)
{
maxbuffer = max;
maxElement = arr[i][j 1];
}
}
if(arr[i][j 1]<=arr[i][j])
{
max=buffer;
if(maxbuffer<max)
{ maxbuffer = max;
maxElement = arr[i][j 1];
}
buffer = 1;
}
}
minElement = (maxElement 1)-maxbuffer;

for( i = minElement; i<=maxElement; i  )
{

printf("%dt", arr[i][j]);
}
}
}


int main() {

int A[5][100];
int stime;
stime=time(NULL);
srand(stime);
random1(A);
pthread_t k1,k2;
pthread_create(&k1, NULL, (void*)thread_func1,(int*)A);
pthread_join(k1,NULL);
printf("%ld",k1);
exit (0);
}
Еще один пример реализации функции thread_func1, но там тоже выходит эта ошибка
void* thread_func1(int arr[5][100]){
int start=0, lenght=1, max_start=0, max_lenght=0;
int i,j;
for(i=0;i<5;i  ){
for(j=0;j<100;j  ){
for(int k=j 1;k<100;k  )
{
if(arr[i][j]<arr[i][k])
lenght  ;
else{
if(lenght>max_lenght)
max_lenght= lenght, max_start=start;
start = k, lenght = 1;
}
}
}
}
for(i = max_start; i<max_start max_lenght; i  ){
for (j=max_start; i<max_start max_lenght; i  ){
printf("%p", arr[i][j]);}}}
Ошибка:segmentation fault (core dumped): как можно исправить (shared memory) c
Ошибка слишком проста – Вы пытаетесь обращаться к объекту, который не создали
std::queue<std::string>* str = (std::queue<std::string>*)shmat(ShmID, 0, 0);
то есть, str указывает на память, но что там… а кто его знает. Если обычную структуру так можно размещать, то с классы нужно только через конструктор.
// получим указатель на память
void *p = shmat(ShmID, 0, 0);
// используем placement new для создания объекта по месту
std::queue<std::string> * str = new(p)std::queue<std::string>();
после такого изменения уже не падает. Но нужно не забыть вызвать деструктор (delete str;). И видимо его нужно вызвать только в одном из процессов. И самое главное – не вызвать его тогда, когда ещё другой процесс использует его.
Также нужно аккуратно посинхронизировать обращения к памяти, а то может быть очень весело – std::queue не ожидает, что он работает с разных процессов.
Способ 1: seh
Если Вы используете OS Windows в качестве целевой ОС и Visual C в качестве компилятора, то Вы можете использовать
— расширение языка С от Microsoft, позволяющее отлавливать любые исключения, происходящие в программе.
Общий синтаксис обработки исключений выглядит следующим образом:
__try
{
  segfault1();
}
__except( condition1 )
{
  // обработка исключения, если condition1 == EXCEPTION_EXECUTE_HANDLER.
  // в condition1 может (должен) быть вызов метода, проверяющего
  //    тип исключения, и возвращающего EXCEPTION_EXECUTE_HANDLER
  //    если тип исключения соответствует тому, что мы хотим обработать
}
__except( condition2 )
{
  // еще один обработчик
}
__finally
{
  // то, что выполнится если ни один из обработчиков не почешется
}
Вот «работающий пример» — «скопируй и вставь в Visual Studio»
#include <stdio.h>
#include <windows.h>
#include <excpt.h>

int memento() // обработка Segfault
{
	MessageBoxA(NULL,"Memento Mori","Exception catched!",NULL);
	return 0;
}

void fall() // генерация segfault
{
	  int* p = 0x00000000;
	  *p = 13;
}

int main(int argc, char *argv[])
{
	__try
	{
		fall();
	}
	__except (EXCEPTION_EXECUTE_HANDLER)
	{
		memento();
	}
}
Мне лично не удалось заставить заработать __finally (поэтому я и написал __except с кодом проверки, который всегда работает), но это, возможно, кривизна моих рук.
Данная методика, при всей ее привлекательности, имеет ряд минусов:
- Один компилятор. Одна ОС. Не «чистый С ». Если Вы хотите работать без средств MS — Вы не сможете использовать эту методику
- Один поток — одна таблица. Если Вы напишете конструкцию из __try… __except, внутри __try запустите другой поток и, не выходя из __try второй поток вызовет segfault, то… ничего не произойдет, программа упадет «как обычно». Потому, что на каждый поток нужно писать отдельный обработчик SEH.
Минусов оказалось настолько много, что приходится искать второе решение.
Способ 2: posix — сигналы
Способ рассчитан на то, что в момент падения программа получает POSIX-сообщение SIGSEGV. Это безусловно так во всех UNIX-системах, но это фактически так (хотя никто не гарантировал, windows — не posix-совместима) и в windows тоже.
Методика простая — мы должны написать обработчик сообщения SIGSEGV, в котором программа совершит «прощальные действия» и, наконец, упадет:
void posix_death_signal(int signum)
{
	memento(); // прощальные действия
        signal(signum, SIG_DFL); // перепосылка сигнала
	exit(3); //выход из программы. Если не сделать этого, то обработчик будет вызываться бесконечно.
}
после чего мы должны зарегистрировать этот обработчик:
signal(SIGSEGV, posix_death_signal);
Вот готовый пример:
#include <stdio.h>
#include <stdio.h>
#include <windows.h>
#include <stdlib.h>
#include <signal.h>


int memento()
{
	int a=0;
	MessageBoxA(NULL,"Memento mori","POSIX Signal",NULL);
	return 0;
}
void fall()
{
	  int* p = 0x00000000;
	  *p = 13;
}
void posix_death_signal(int signum)
{
	memento();
	signal(signum, SIG_DFL);
	exit(3);
}


int main(int argc, char *argv[])
{
	signal(SIGSEGV, posix_death_signal);
	fall();
}
В отличие от SEH, это работает всегда: решение «многопоточное» (вы можете уронить программу в любом потоке, обработчик запустится в любом случае) и «кроссплатформенное» — работает под любым компилятором, и под любой POSIX-совместимой ОС.
|
Сергей2109 0 / 0 / 0 Регистрация: 23.01.2017 Сообщений: 3 |
||||
|
1 |
||||
|
23.01.2017, 20:30. Показов 53174. Ответов 7 Метки нет (Все метки)
Всем доброго времени суток. Не могли бы посмотреть кусок программы и подсказать ошибку. При компиляции ничего не выдаёт, а вот при запуске пишет Segmentation fault (core dumped). Спасибо всем.
0 |

|
Nemovok 296 / 125 / 106 Регистрация: 30.10.2015 Сообщений: 690 |
||||
|
23.01.2017, 20:38 |
2 |
|||
|
Эта ошибка означает, что вы вышли за границы массива.
Думаю меня поправят, если что
1 |
")
|
drfaust 569 / 397 / 130 Регистрация: 02.10.2008 Сообщений: 1,647 Записей в блоге: 1 |
||||||||
|
23.01.2017, 20:41 |
3 |
|||||||
|
Попробуйте i-j взять в скобки (не помню приоритеты):
Так же прога может вылетать в содержимом graph().
0 |

|
0 / 0 / 0 Регистрация: 23.01.2017 Сообщений: 3 |
|
|
23.01.2017, 20:44 [ТС] |
4 |
|
if (i-j>=0) out[i]+=koef[j]*in[i-j]; На этот случай есть условие, так что не знаю где там ещё может быть.
0 |
|
296 / 125 / 106 Регистрация: 30.10.2015 Сообщений: 690 |
|
|
23.01.2017, 20:50 |
5 |
|
if (i-j>=0) Не заметил
0 |

|
0 / 0 / 0 Регистрация: 23.01.2017 Сообщений: 3 |
|
|
23.01.2017, 20:51 [ТС] |
6 |
|
Тут вылетает именно в этой функции. Все проверил уже раз на сто). Не знаю почему, но если её запущу отдельно (как другая программа), то всё нормально. Вот и пытаюсь решить в чём проблема.
0 |
|
569 / 397 / 130 Регистрация: 02.10.2008 Сообщений: 1,647 Записей в блоге: 1 |
|
|
23.01.2017, 20:59 |
7 |
|
Тут вылетает именно в этой функции. C — язык весёлый. Если есть косяк (выход за пределы диапазона/выделенной памяти), то вылезти может где угодно. Я помниться в сотне килобайт исходников две недели ковырялся, в поисках бага — оказалось повторное освобождение памяти в очереди сообщений, а вылазило редко, не всегда и в самых неожиданных местах.
1 |
|
Вездепух
10915 / 5910 / 1615 Регистрация: 18.10.2014 Сообщений: 14,857 |
|
|
23.01.2017, 22:12 |
8 |
|
При компиляции ничего не выдаёт, а вот при запуске пишет Segmentation fault (core dumped). Где информация о том, в каком именно месте кода это происходит? Почему она не приведена в вашем первом сообщении? Существует миллион причин, по которым может произойти эта ошибка, и в вашем коде есть предпосылки для множества из этих причин. Каким образом вы предполагаете нам угадать, что вы передаете в эту функцию, существуют файлы, которые вы пытаетесь открывать, и что происходит в загадочной функции
0 |
|
IT_Exp Эксперт 87844 / 49110 / 22898 Регистрация: 17.06.2006 Сообщений: 92,604 |
23.01.2017, 22:12 |
|
Помогаю со студенческими работами здесь Segmentation fault Ребята чем отличается функция… Segmentation fault в релизе Pcap_close(): Segmentation fault Массив: Segmentation fault Искать еще темы с ответами Или воспользуйтесь поиском по форуму: 8 |
What does it mean?
See AU: What is a segmentation fault? post and also this post which have some examples how reproduce it, SO: What is segmentation fault?.
The simplest description I can come with (may be not the perfect):
The program tried to access a memory area out side its own section. Operating system blocks it.
Some cases: Reading value with uninitialized pointer, Going out of range in an array, Function call (when backward compatibility not maintained), …
However, it is not always easy find the cause with large programs or those which relay on other project lib’s. And most of the cases end up with a bug report, either for target program or one of its dependencies (either upstream project or downstream distribution package).
How can I resolve this issue?
-
Fire a bug report
If you didn’t make any custom configuration/setup and you all updates installed. fire a bug report, see How do I report a bug?
If open source supported by Ubuntu use
ubuntu-bug(apport-bug). For 3rd party closed source, check their help pages how to report bugs and collect related data. -
Take initiative to debug
If you you have even a little programming background, it is recommended that you try your best to resolve it yourself. There many bug reports out there inactive for years. At least, you may be able to collect enough debug data that help resolve the issue when reporting it.
That’s means that you are breaking the user abstraction level and opening the black box! (FLOSS actually has transparent box).
Some Useful Tools for Debugging
Some … I mean there are many other useful tools out there that you gonna find when you dig in more.
-
apport-buglogs / core dump / backtraceIf you don’t have an error message before segmentation fault. Run it with
--saveoption and look for back-trace log:apport-bug program-cmd --save bug-report_output.txt -
gdbbacktrace / debuging source codeIf it didn’t work, use
gdb:$ gdb program-cmd (gdb) run (gdb) backtraceIf you get any error message, check the web, launchpad and in upstream project bug tracker if there any similar cases.
For some advanced users or who are following a c/c++ learning path, they could download the corresponding
-dbgsymbols packages. Then you can usegdbto trace program flow through the source and get the exact function/instruction that raise the runtime error.For Ubuntu(Debian) based distributions, source code of a package can be downloaded using:
apt-get source <package-name> -
stracesystem call tracingAnother tool that may help is
strace, I like it. It’s really a powerful tool.It presents itself:
In the simplest case
straceruns the specified command until it exits. It intercepts and records the system calls which are called by a
process and the signals which are received by a process. The name of each system call, its arguments and its return value are printed on
standard error or to the file specified with the -o option.straceis a useful diagnostic, instructional, and debugging tool. System administrators, diagnosticians and trouble-shooters will find it
invaluable for solving problems with programs for which the source is not readily available since they do not need to be recompiled in
order to trace them. Students, hackers and the overly-curious will find that a great deal can be learned about a system and its system
calls by tracing even ordinary programs. And programmers will find that since system calls and signals are events that happen at the
user/kernel interface, a close examination of this boundary is very useful for bug isolation, sanity checking and attempting to capture
race conditions.Source:
man strace -
ltracedynamic library call tracingltraceis a program that simply runs the specified command until
it
exits. It intercepts and records the dynamic library calls which are
called by the executed process and the signals which are received by
that process. It can also intercept and print the system calls exe‐
cuted by the program.Its use is very similar to
strace(1).Source:
man ltrace
Segmentation faults commonly occur when programs attempt to access memory regions that they are not allowed to access. This article provides an overview of segmentation faults with practical examples. We will discuss how segmentation faults can occur in x86 assembly as well as C along with some debugging techniques.
See the previous article in the series, How to use the ObjDump tool with x86.
What are segmentation faults in x86 assembly?
A segmentation fault occurs when a program attempts to access a memory location that it is not allowed to access, or attempts to access a memory location in a way that is not allowed (for example, attempting to write to a read-only location).
Let us consider the following x86 assembly example.
message db “Welcome to Segmentation Faults! ”
section .text
global _start
_printMessage:
mov eax, 4
mov ebx, 1
mov ecx, message
mov edx, 32
int 0x80
ret
_start:
call _printMessage
As we can notice, the preceding program calls the subroutine _printMessage when it is executed. When we read this program without executing, it looks innocent without any evident problems. Let us assemble and link it using the following commands.
ld print.o -o print -m elf_i386
Now, let us run the program and observe the output.
Welcome to Segmentation Faults! Segmentation fault (core dumped)
As we can notice in the preceding excerpt, there is a segmentation fault when the program is executed.
How to detect segmentation faults in x86 assembly
Segmentation faults always occur during runtime but they can be detected at the code level. The previous sample program that was causing the segmentation faults, is due to lack of an exit routine within the program. So when the program completes executing the code responsible for printing the string, it doesn’t know how to exit and thus lands on some invalid memory address.
Another way to detect segmentation faults is to look for core dumps. Core dumps are usually generated when there is a segmentation fault. Core dumps provide the situation of the program at the time of the crash and thus we will be able to analyze the crash. Core dumps must be enabled on most systems as shown below.
When a segmentation fault occurs, a new core file will be generated as shown below.
Welcome to Segmentation Faults! Segmentation fault (core dumped)
$ ls
core seg seg.nasm seg.o
$
As shown in the proceeding excerpt, there is a new file named core in the current directory.
How to fix segmentation faults x86 assembly
Segmentation faults can occur due to a variety of problems. Fixing a segmentation fault always depends on the root cause of the segmentation fault. Let us go through the same example we used earlier and attempt to fix the segmentation fault. Following is the original x86 assembly program causing a segmentation fault.
message db “Welcome to Segmentation Faults! ”
section .text
global _start
_printMessage:
mov eax, 4
mov ebx, 1
mov ecx, message
mov edx, 32
int 0x80
ret
_start:
call _printMessage
As mentioned earlier, there isn’t an exit routine to gracefully exit this program. So, let us add a call to the exit routine immediately after the control is returned from _printMessage. This looks as follows
message db “Welcome to Segmentation Faults! ”
section .text
global _start
_printMessage:
mov eax, 4
mov ebx, 1
mov ecx, message
mov edx, 32
int 0x80
ret
_exit:
mov eax, 1
mov ebx, 0
int 0x80
_start:
call _printMessage
call _exit
Notice the additional piece of code added in the preceding excerpt. When _printMessage completes execution, the control will be transferred to the caller and call _exit instruction will be executed, which is responsible for gracefully exiting the program without any segmentation faults. To verify, let us assemble and link the program using the following commands.
ld print-exit.o -o print-exit -m elf_i386
Run the binary and we should see the following message without any segmentation fault.
Welcome to Segmentation Faults!
$
As mentioned earlier, the solution to fix a segmentation fault always depends on the root cause.
How to fix segmentation fault in c
Segmentation faults in C programs are often seen due to the fact that C programming offers access to low-level memory. Let us consider the following example written in C language.
{
char *str;
str = “test string”;
*(str+1) = ‘x’;
return 0;
}
The preceding program causes a segmentation fault when it is run. The string variable str in this example stores in read-only part of the data segment and we are attempting to modify read-only memory using the line *(str+1) = ‘x’;
Similarly, segmentation faults can occur when an array out of bound is accessed as shown in the following example.
{
char test[3];
test[4] = ‘A’;
}
This example also leads to a segmentation fault. In addition to it, if the data being passed to the test variable is user-controlled, it can lead to stack-based buffer overflow attacks. Running this program shows the following error due to a security feature called stack cookies.
*** stack smashing detected ***: terminated
Aborted (core dumped)
$
The preceding excerpt shows that the out-of-bound access on an array can also lead to segfaults. Fixing these issues in C programs again falls back to the reason for the Segfault. We should avoid accessing protected memory regions to minimize segfaults.
How to debug segmentation fault
Let us go through our first x86 example that was causing a segfault to get an overview of debugging segmentation faults using gdb. Let us begin by running the program, so we can get the core dump when the segmentation fault occurs.
Welcome to Segmentation Faults! Segmentation fault (core dumped)
$
Now, a core dump should have been generated. Let us load the core dump along with the target executable as shown in the following command. Loading the executable along with the core dump makes the debugging process much easier.
GEF for linux ready, type `gef’ to start, `gef config’ to configure
78 commands loaded for GDB 9.1 using Python engine 3.8
[*] 2 commands could not be loaded, run `gef missing` to know why.
[New LWP 6172]
Core was generated by `./print’.
Program terminated with signal SIGSEGV, Segmentation fault.
#0 0x0804901c in ?? ()
gef➤
As we can notice in the preceding output, the core dump is loaded using GDB and the segmentation fault occurred at the address 0x0804901c. To confirm this, we can check the output of info registers.
eax 0x20 0x20
ecx 0x804a000 0x804a000
edx 0x20 0x20
ebx 0x1 0x1
esp 0xffbe8aa0 0xffbe8aa0
ebp 0x0 0x0
esi 0x0 0x0
edi 0x0 0x0
eip 0x804901c 0x804901c
eflags 0x10202 [ IF RF ]
cs 0x23 0x23
ss 0x2b 0x2b
ds 0x2b 0x2b
es 0x2b 0x2b
fs 0x0 0x0
gs 0x0 0x0
gef➤
As highlighted, the eip register contains the same address. This means, the program attempted to execute the instruction at this address and it has resulted in a segmentation fault. Let us go through the disassembly and understand where this instruction is.
First, let us get the list of functions available and identify which function possibly caused the segfault.
All defined functions:
Non-debugging symbols:
0x08049000 _printMessage
0x08049017 _start
0xf7fae560 __kernel_vsyscall
0xf7fae580 __kernel_sigreturn
0xf7fae590 __kernel_rt_sigreturn
0xf7fae9a0 __vdso_gettimeofday
0xf7faecd0 __vdso_time
0xf7faed10 __vdso_clock_gettime
0xf7faf0c0 __vdso_clock_gettime64
0xf7faf470 __vdso_clock_getres
gef➤
As highlighted in the preceding excerpt, the _printMessage and _start functions’ address ranges are close to the address that caused the segmentation fault. So, let us begin with the disassembly of the function _printMessage.
Dump of assembler code for function _printMessage:
0x08049000 <+0>: mov eax,0x4
0x08049005 <+5>: mov ebx,0x1
0x0804900a <+10>: mov ecx,0x804a000
0x0804900f <+15>: mov edx,0x20
0x08049014 <+20>: int 0x80
0x08049016 <+22>: ret
End of assembler dump.
gef➤
Let us set a breakpoint at ret instruction and run the program. The following command shows how to setup the breakpoint.
Breakpoint 1 at 0x8049016
gef➤
Type run to start the program execution.
0x804900f <_printMessage+15> mov edx, 0x20
0x8049014 <_printMessage+20> int 0x80
→ 0x8049016 <_printMessage+22> ret
↳ 0x804901c add BYTE PTR [eax], al
0x804901e add BYTE PTR [eax], al
0x8049020 add BYTE PTR [eax], al
0x8049022 add BYTE PTR [eax], al
0x8049024 add BYTE PTR [eax], al
0x8049026 add BYTE PTR [eax], al
As we can notice in the preceding excerpt, when the ret instruction gets executed, the control gets passed to the region not controlled by the program code leading to unauthorized memory access and thus a segmentation fault.
Conclusion
This article has outlined some basic concepts around segmentation faults in x86 assembly and how one can use them for debugging programs. We have seen various simple examples to better understand the concepts. We briefly discussed core dumps, which can help us to detect and analyze program crashes.
See the next article in this series, How to control the flow of a program in x86 assembly.
Sources
- https://www.geeksforgeeks.org/core-dump-segmentation-fault-c-cpp/
- http://www.brendangregg.com/blog/2016-08-09/gdb-example-ncurses.html
- https://embeddedbits.org/linux-core-dump-analysis/