
What does it mean?
See AU: What is a segmentation fault? post and also this post which have some examples how reproduce it, SO: What is segmentation fault?.
The simplest description I can come with (may be not the perfect):
The program tried to access a memory area out side its own section. Operating system blocks it.
Some cases: Reading value with uninitialized pointer, Going out of range in an array, Function call (when backward compatibility not maintained), …
However, it is not always easy find the cause with large programs or those which relay on other project lib’s. And most of the cases end up with a bug report, either for target program or one of its dependencies (either upstream project or downstream distribution package).
How can I resolve this issue?
-
Fire a bug report
If you didn’t make any custom configuration/setup and you all updates installed. fire a bug report, see How do I report a bug?
If open source supported by Ubuntu use
ubuntu-bug(apport-bug). For 3rd party closed source, check their help pages how to report bugs and collect related data. -
Take initiative to debug
If you you have even a little programming background, it is recommended that you try your best to resolve it yourself. There many bug reports out there inactive for years. At least, you may be able to collect enough debug data that help resolve the issue when reporting it.
That’s means that you are breaking the user abstraction level and opening the black box! (FLOSS actually has transparent box).
Some Useful Tools for Debugging
Some … I mean there are many other useful tools out there that you gonna find when you dig in more.
-
apport-buglogs / core dump / backtraceIf you don’t have an error message before segmentation fault. Run it with
--saveoption and look for back-trace log:apport-bug program-cmd --save bug-report_output.txt -
gdbbacktrace / debuging source codeIf it didn’t work, use
gdb:$ gdb program-cmd (gdb) run (gdb) backtraceIf you get any error message, check the web, launchpad and in upstream project bug tracker if there any similar cases.
For some advanced users or who are following a c/c++ learning path, they could download the corresponding
-dbgsymbols packages. Then you can usegdbto trace program flow through the source and get the exact function/instruction that raise the runtime error.For Ubuntu(Debian) based distributions, source code of a package can be downloaded using:
apt-get source <package-name> -
stracesystem call tracingAnother tool that may help is
strace, I like it. It’s really a powerful tool.It presents itself:
In the simplest case
straceruns the specified command until it exits. It intercepts and records the system calls which are called by a
process and the signals which are received by a process. The name of each system call, its arguments and its return value are printed on
standard error or to the file specified with the -o option.straceis a useful diagnostic, instructional, and debugging tool. System administrators, diagnosticians and trouble-shooters will find it
invaluable for solving problems with programs for which the source is not readily available since they do not need to be recompiled in
order to trace them. Students, hackers and the overly-curious will find that a great deal can be learned about a system and its system
calls by tracing even ordinary programs. And programmers will find that since system calls and signals are events that happen at the
user/kernel interface, a close examination of this boundary is very useful for bug isolation, sanity checking and attempting to capture
race conditions.Source:
man strace -
ltracedynamic library call tracingltraceis a program that simply runs the specified command until
it
exits. It intercepts and records the dynamic library calls which are
called by the executed process and the signals which are received by
that process. It can also intercept and print the system calls exe‐
cuted by the program.Its use is very similar to
strace(1).Source:
man ltrace
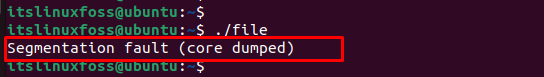
In Linux, the error “segmentation fault (core dumped)” comes across during the execution of the script file (C, C++, Python, Java) from the terminal. The core dump is when a code performs read and write operations on a free memory location.
This article will provide multiple solutions to the above-stated “segmentation fault (core dumped)” error. The supported content of this guideline is as follows:
- Reason: Attempting the Non-Existing Memory
- Solution 1: Remove the Lock File
- Solution 2: Kill the Specific Process
Reason: Attempting the Non-Existing Memory
The main cause of this error is that you are trying to access a specific portion of memory that does not exist. For instance, when users try to read or write the elements of a non-existent array, do not define the pointer before using it or use a memory address with the same variable value. Therefore, the particular program will crash and display the “segmentation fault” error when executing the file:
The next sections contain several solutions to encounter the above error.
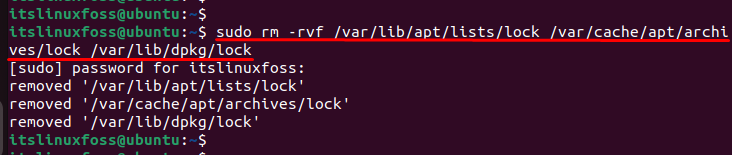
Solution 1: Remove the Lock File
During the execution of a program, locked files are created to make the script files executable. To resolve the error, one of the solutions is to remove the lock file that attempts the non-existent memory. For removing these files, the “rm” command is used to delete the lock files:
$ sudo rm -rvf /var/lib/apt/lists/lock /var/cache/apt/archives/lock /var/lib/dpkg/lock
Let’s head over to another solution.
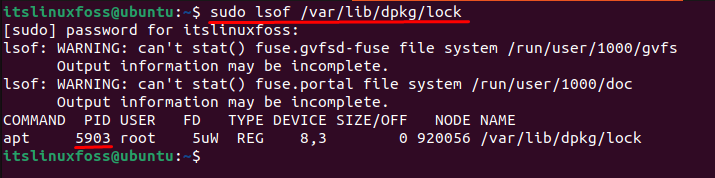
Solution 2: Kill the Specific Process
Users can consider another solution to resolve errors by killing the specific process. First, locate the process id stored in the “/var/lib/dpkg/lock” directory:
$ sudo lsof /var/lib/dpkg/lock
After identifying the specific process id, you can go to terminate the process. For this, the “kill” command is utilized with a “-9” signal that forcefully terminates the running process “5903”:
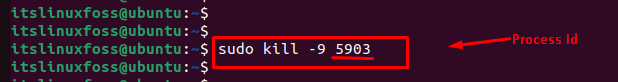
You can verify that the “kill” command terminates the specific process via “5903” id.
Conclusion
In Linux, the error “segmentation fault (core dumped)” occurs when the process requires additional memory that the operating system does not permit access. It can be resolved by removing the “lock” files through the “rm” command, clearing the cache repository, or killing the process via “process id”. This article has explained all possible solutions to encounter the error mentioned above.
The core file is normally called core and is located in the current working directory of the process. However, there is a long list of reasons why a core file would not be generated, and it may be located somewhere else entirely, under a different name. See the core.5 man page for details:
DESCRIPTION
The default action of certain signals is to cause a process to
terminate and produce a core dump file, a disk file containing an
image of the process’s memory at the time of termination. This image
can be used in a debugger (e.g., gdb(1)) to inspect the state of the
program at the time that it terminated. A list of the signals which
cause a process to dump core can be found in signal(7).…
There are various circumstances in which a core dump file is not produced:
   *  The process does not have permission to write the core file.  (By
      default, the core file is called core or core.pid, where pid is
      the ID of the process that dumped core, and is created in the
      current working directory.  See below for details on naming.)
      Writing the core file will fail if the directory in which it is to
      be created is nonwritable, or if a file with the same name exists
      and is not writable or is not a regular file (e.g., it is a
      directory or a symbolic link).
   *  A (writable, regular) file with the same name as would be used for
      the core dump already exists, but there is more than one hard link
      to that file.
   *  The filesystem where the core dump file would be created is full;
      or has run out of inodes; or is mounted read-only; or the user has
      reached their quota for the filesystem.
   *  The directory in which the core dump file is to be created does
      not exist.
   *  The RLIMIT_CORE (core file size) or RLIMIT_FSIZE (file size)
      resource limits for the process are set to zero; see getrlimit(2)
      and the documentation of the shell's ulimit command (limit in
      csh(1)).
   *  The binary being executed by the process does not have read
      permission enabled.
   *  The process is executing a set-user-ID (set-group-ID) program that
      is owned by a user (group) other than the real user (group) ID of
      the process, or the process is executing a program that has file
      capabilities (see capabilities(7)).  (However, see the description
      of the prctl(2) PR_SET_DUMPABLE operation, and the description of
      the /proc/sys/fs/suid_dumpable file in proc(5).)
   *  (Since Linux 3.7) The kernel was configured without the
      CONFIG_COREDUMP option.
In addition, a core dump may exclude part of the address space of the
process if the madvise(2) MADV_DONTDUMP flag was employed.Naming of core dump files
By default, a core dump file is named core, but the
/proc/sys/kernel/core_pattern file (since Linux 2.6 and 2.4.21) can
be set to define a template that is used to name core dump files.
The template can contain % specifiers which are substituted by the
following values when a core file is created:%% a single % character %c core file size soft resource limit of crashing process (since Linux 2.6.24) %d dump mode—same as value returned by prctl(2) PR_GET_DUMPABLE (since Linux 3.7) %e executable filename (without path prefix) %E pathname of executable, with slashes ('/') replaced by exclamation marks ('!') (since Linux 3.0). %g (numeric) real GID of dumped process %h hostname (same as nodename returned by uname(2)) %i TID of thread that triggered core dump, as seen in the PID namespace in which the thread resides (since Linux 3.18) %I TID of thread that triggered core dump, as seen in the initial PID namespace (since Linux 3.18) %p PID of dumped process, as seen in the PID namespace in which the process resides %P PID of dumped process, as seen in the initial PID namespace (since Linux 3.12) %s number of signal causing dump %t time of dump, expressed as seconds since the Epoch, 1970-01-01 00:00:00 +0000 (UTC) %u (numeric) real UID of dumped process

This error may strike your Ubuntu at any point at the moment. A few days ago when I was doing my routine work in my Ubuntu laptop, suddenly I encountered with an error “Segmentation fault ( core dumped)” then I got to know that, this error can strike you Ubuntu or any other operating system at any point of the moment as binaries crashing doesn’t depend on us.
Segmentation fault is when your system tries to access a page of memory that doesn’t exist. Core dumped means when a part of code tries to perform read and write operation on a read-only or free location. Segfaults are generally associated with the file named core and It generally happens during up-gradation.

While running some commands during the core-dump situation you may encounter with “Unable to open lock file” this is because the system is trying to capture a bit block which is not existing, This is due to the crashing of binaries of some specific programs.
You may do backtracking or debugging to resolve it but the solution is to repair the broken packages and we can do it by performing the below-mentioned steps:
Command-line:
Step 1: Remove the lock files present at different locations.
sudo rm -rf /var/lib/apt/lists/lock /var/cache/apt/archives/lock /var/lib/dpkg/lock and restart your system h.cdccdc
Step 2: Remove repository cache.
Step 3: Update and upgrade your repository cache.
sudo apt-get update && sudo apt-get upgrade
Step 4: Now upgrade your distribution, it will update your packages.
sudo apt-get dist-upgrade
Step 5: Find the broken packages and delete them forcefully.
sudo dpkg -l | grep ^..r | apt-get purge
Apart from the command line, the best way which will always work is:
Step 1: Run Ubuntu in startup mode by pressing the Esc key after the restart.
Step 2: Select Advanced options for Ubuntu

Step 3: Run Ubuntu in the recovery mode and you will be listed with many options.

Step 4: First select “Repair broken packages”

Step 5: Then select “Resume normal boot”
So, we have two methods of resolving segmentation fault: CLI and the GUI. Sometimes, it may also happen that the “apt” command is not working because of segfault, so our CLI method will not work, in that case also don’t worry as the GUI method gonna work for us always.
Не всегда программы в Linux запускаются как положено. Иногда, в силу разных причин программа вместо нормальной работы выдает ошибку. Но нам не нужна ошибка, нам нужна программа, вернее, та функция, которую она должна выполнять. Сегодня мы поговорим об одной из самых серьезных и непонятных ошибок. Это ошибка сегментации Ubuntu. Если такая ошибка происходит только один раз, то на нее можно не обращать внимания, но если это регулярное явление нужно что-то делать.
Конечно, случается эта проблема не только в Ubuntu, а во всех Linux дистрибутивах, поэтому наша инструкция будет актуальна для них тоже. Но сосредоточимся мы в основном на Ubuntu. Рассмотрим что такое ошибка сегментирования linux, почему она возникает, а также как с этим бороться и что делать.
Что такое ошибка сегментации?
Ошибка сегментации, Segmentation fault, или Segfault, или SIGSEGV в Ubuntu и других Unix подобных дистрибутивах, означает ошибку работы с памятью. Когда вы получаете эту ошибку, это значит, что срабатывает системный механизм защиты памяти, потому что программа попыталась получить доступ или записать данные в ту часть памяти, к которой у нее нет прав обращаться.
Чтобы понять почему так происходит, давайте рассмотрим как устроена работа с памятью в Linux, я попытаюсь все упростить, но приблизительно так оно и работает.
Допустим, в вашей системе есть 6 Гигабайт оперативной памяти, каждой программе нужно выделить определенную область, куда будет записана она сама, ее данные и новые данные, которые она будет создавать. Чтобы дать возможность каждой из запущенных программ использовать все шесть гигабайт памяти был придуман механизм виртуального адресного пространства. Создается виртуальное пространство очень большого размера, а из него уже выделяется по 6 Гб для каждой программы. Если интересно, это адресное пространство можно найти в файле /proc/kcore, только не вздумайте никуда его копировать.
Выделенное адресное пространство для программы называется сегментом. Как только программа попытается записать или прочитать данные не из своего сегмента, ядро отправит ей сигнал SIGSEGV и программа завершится с нашей ошибкой. Более того, каждый сегмент поделен на секции, в некоторые из них запись невозможна, другие нельзя выполнять, если программа и тут попытается сделать что-то запрещенное, мы опять получим ошибку сегментации Ubuntu.
Почему возникает ошибка сегментации?
И зачем бы это порядочной программе лезть, куда ей не положено? Да в принципе, незачем. Это происходит из-за ошибки при написании программ или несовместимых версиях библиотек и ПО. Часто эта ошибка встречается в программах на Си или C++. В этом языке программисты могут вручную работать с памятью, а язык со своей стороны не контролирует, чтобы они это делали правильно, поэтому одно неверное обращение к памяти может обрушить программу.
Почему может возникать эта ошибка при несовместимости библиотек? По той же причине — неверному обращению к памяти. Представим, что у нас есть библиотека linux (набор функций), в которой есть функция, которая выполняет определенную задачу. Для работы нашей функции нужны данные, поэтому при вызове ей нужно передать строку. Наша старая версия библиотеки ожидает, что длина строки будет до 256 символов. Но программа была обновлена формат записи поменялся, и теперь она передает библиотеке строку размером 512 символов. Если обновить программу, но оставить старую версию библиотеки, то при передаче такой строки 256 символов запишутся нормально в подготовленное место, а вот вторые 256 перезапишут данные программы, и возможно, попытаются выйти за пределы сегмента, тогда и будет ошибка сегментирования linux.
Что делать если возникла ошибка сегментирования?
Если вы думаете, что это ошибка в программе, то вам остается только отправить отчет об ошибке разработчикам. Но вы все-таки еще можете попытаться что-то сделать.
Например, если падает с ошибкой сегментации неизвестная программа, то мы можем решить что это вина разработчиков, но если с такой ошибкой падает chrome или firefox при запуске возникает вопрос, может мы делаем что-то не так? Ведь это уже хорошо протестированные программы.
Первое, что нужно сделать — это обновить систему до самой последней версии, возможно, был баг и его уже исправили, а может у вас установлены старые версии библиотек и обновление решит проблему. В Ubuntu это делается так:
sudo apt update
sudo apt full-upgrade
Если это не помогло, нужно обнулить настройки программы до значений по умолчанию, возможно, удалить кэш. Настройки программ в Linux обычно содержатся в домашней папке, скрытых подкаталогах с именем программы. Также, настройки и кэш могут содержаться в каталогах ~/.config и ~/.cache. Просто удалите папки программы и попробуйте снова ее запустить. Если и это не помогло, вы можете попробовать полностью удалить программу, а потом снова ее установить, возможно, какие-нибудь зависимости были повреждены:
sudo apt remove пакет_программы
sudo apt autoremove
sudo apt install пакет_программы
Если есть возможность, попробуйте установить программу из другого источника, например, не из PPA, а более старую версию, из официальных репозиториев.
Когда вы все это выполнили, скорее всего, проблема не в вашем дистрибутиве, а в самой программе. Нужно отправлять отчет разработчикам. В Ubuntu это можно сделать с помощью программы apport-bug. Обычно Ubuntu предлагает это сделать сразу, после того как программа завершилась с ошибкой сегментирования. Если же ошибка сегментирования Ubuntu встречается не в системной программе, то вам придется самим искать разработчиков и вручную описывать что произошло.
Чтобы помочь разработчикам решить проблему, недостаточно отправить им только сообщение что вы поймали Segmentation Fault, нужно подробно описать проблему, действия, которые вы выполняли перед этим, так чтобы разработчик мог их воспроизвести. Также, желательно прикрепить к отчету последние функции, которые вызывала программа (стек вызовов функций), это может очень сильно помочь разработчикам.
Рассмотрим, как его получить. Это не так уж сложно. Сначала запустите вашу программу, затем узнайте ее PID с помощью команды:
pgrep программа
Дальше запускаем отладчик gdb:
sudo gdb -q
Подключаемся к программе:
(gdb) attach ваш_pid
После подключения программа станет на паузу, продолжаем ее выполнение командой:
(gdb) continue

Затем вам осталось только вызвать ошибку:
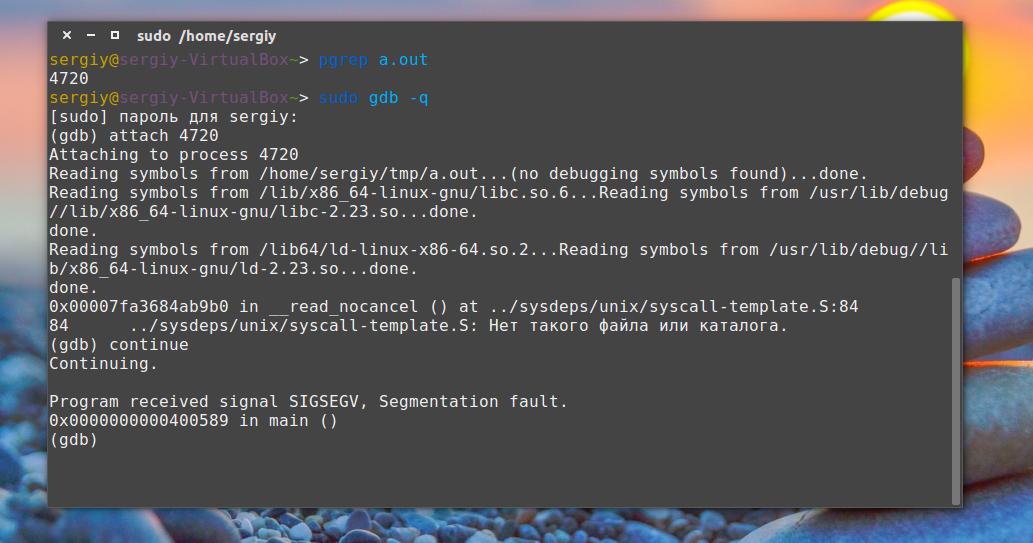
И набрать команду, которая выведет стек последних вызовов:
(gdb) backtrace
Вывод этой команды и нужно отправлять разработчикам. Чтобы отключиться от программы и выйти наберите:
(gdb) detach

(gdb) quit
Дальше остается отправить отчет и ждать исправления ошибки. Если вы не уверены, что ошибка в программе, можете поспрашивать на форумах. Когда у вас есть стек вызовов, уже можно попытаться, если не понять в чем проблема, то попытаться узнать, не сталкивался ли с подобной проблемой еще кто-то.
Выводы
Теперь у вас есть приблизительный план действий, что нужно делать, когда появляется ошибка сегментирования сделан дамп памяти ubuntu. Если вы знаете другие способы решить эту проблему, напишите в комментариях!
Обнаружили ошибку в тексте? Сообщите мне об этом. Выделите текст с ошибкой и нажмите Ctrl+Enter.

Статья распространяется под лицензией Creative Commons ShareAlike 4.0 при копировании материала ссылка на источник обязательна .