I ran into this problem after removing my VMWare ESX servers from vCenter 6.5 and adding them to a new vCenter 6.7 appliance.
Issue was caused by the sfcbd-watchdog on the ESX servers being unable to start as there were stale lock files left behind. This service is used to monitor hardware health in the ESX server.
Enable SSH on the ESX hosts, log in as root and check if the process is running by typing «/etc/init.d/sfcbd-watchdog status». If it’s stopped, try starting with «/etc/init.d/sfcbd-watchdog start». If you get a message «giving up on lock…», you have a stale lock file. Delete the file it mentions, then go and start the service.
So in the Homelab life each weekend is normally the “Fix it” time. If I can get time outside of the weekend I’ll try to get to it, because my OCD just drives me nuts seeing that red. Usually though it falls on the weekend.
This weekend the errors I looked at are the following:
PostgresSQL Archiver error
So for this I did some research in VMTN and also a lot of other blogs etc. The key points were what I found in the vCenter Log here:
In /var/log/vmware/vpostgres/pg_archiver.log-[n].stderr, you see error similar to:
2018-05-22T10:27:36.133Z ERROR  pg_archiver could not receive data from WAL stream: server closed the connection unexpectedly

This probably means the server terminated abnormally

before or while processing the request.
So this KB points to an HA or Timeout error, and I was seeing these errors, but the issue was the Watchdog service. After some more google-fu I came across Magander3’s Post Which all credit goes to for this fix. Basically here is what I did:
On each ESXI host in your cluster login via SSH and run the following command, “/etc/init.d/sfcbd-watchdog status” This should return “sfcbd is not running"
- If this is the case try “
/etc/init.d/sfcbd-watchdog start” just to see if that will help. - If it starts great! Run the start command on each ESXI host.
- If not run “
esxcli system wbem get” and you should get a fair amount of data, but your looking for “Enabled:false” - If you see that run “
esxcli system wbem set –enable true” There are two “-” before enable. This should show “Enabled:true” - Run the previous “
wbem get” command And you should see “Enabled:true” now. - Run your “
/etc/init.d/sfcbd-watchdog status” again and it should show true.
After this ran on each ESXI host the error service started on vCenter and I could reset it.
PSC Service Health Alarm
This was a poser, and there are still a lot of different PSC errors in VMTN for 6.7u2. Well, I did a vCenter upgrade, some other house cleaning to see if it would clear this error, Then I found the following KB which basically tells you to sync the time across ESXI hosts and vCenter.
But the issue for me was how the sync was setup. I set everything to the same NTP server and the same time zone, but nothing worked. For some reason the PSC service just still would not work.
I fixed it by turning off NTP on the vCenter server and setting it to sync to the host. Once I set that up, BOOM it started.
Hope this helps someone, Sorry for the lack of pictures as I know those help. Have a good Monday!
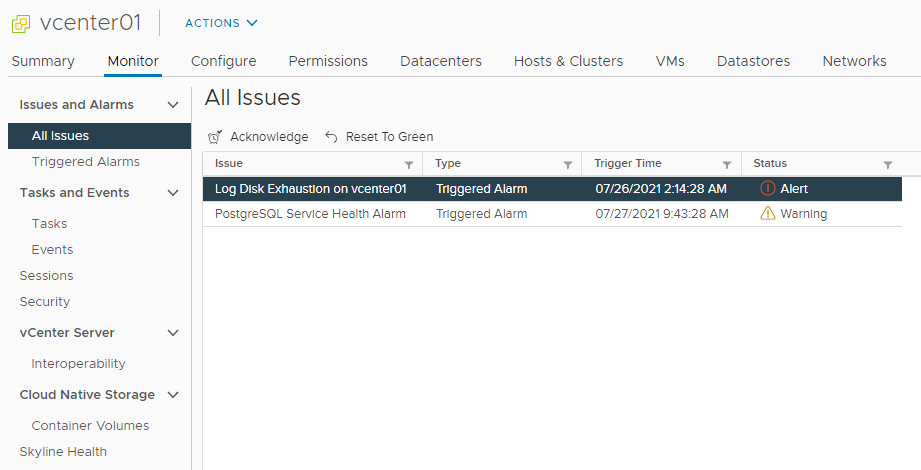
vCenter 7 показывает ошибку: Log Disk Exhaustion on vcenter. Данная ошибка сопровождается предупреждениями от запущенных служб, например: PostgreSQL Service Health Alarm. Полечим.
Более подробной информации об ошибке в vCenter не отображается. Из названия понятно, что ошибка связана с нехваткой места на диске для логов.
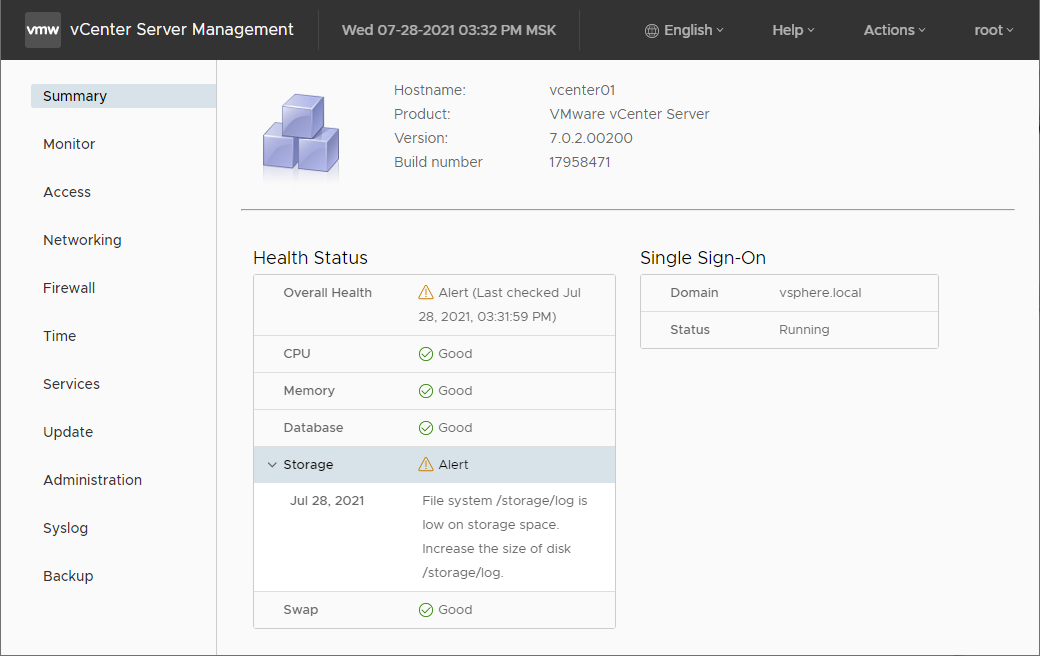
Если зайти в vCenter Server Management интерфейс VAMI, то можно узнать немного подробностей:
File system /storage/log is low on storage space. Increase the size of disk /storage/log.
Виден путь к директории, где нет места: /storage/log.
Примечательно, что в vCenter отображаются не все ошибки служб. Перейдём в раздел Services.
Служба VMware Postgres сообщает об ошибке:
Filesystem holding service vmware-vpostgres error logs is running low on available space.
Служба VMware vTSDB Service тоже сообщает об ошибке:
Filesystem holding service vtsdb error logs is running low on available space.
Это служба Timescale DB, которая тесно связана с PostgreSQL.
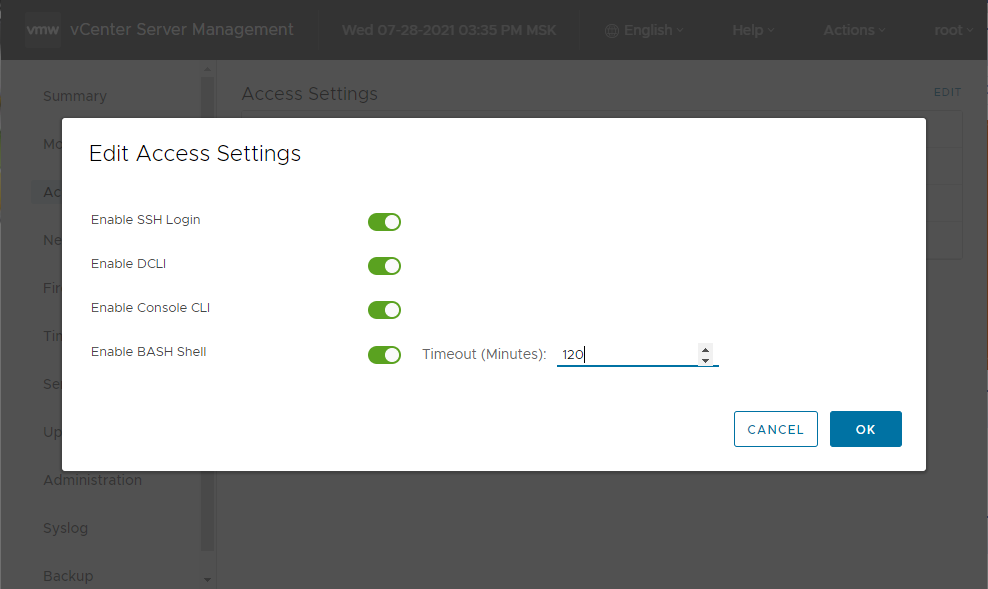
Причина ошибки ясна, будем разбираться куда подевалось место в /storage/log. Включаем на vCenter SSH.
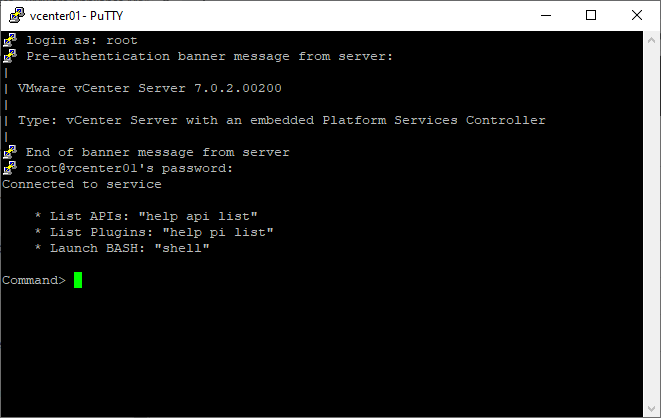
Коннектимся к vCenter по SSH под пользователем root.
Работаем под рутом, для этого используем команду:
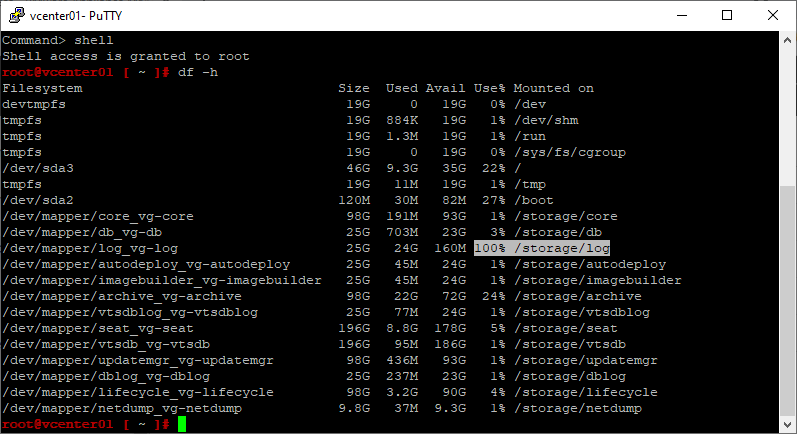
shellПосмотрим на диски:
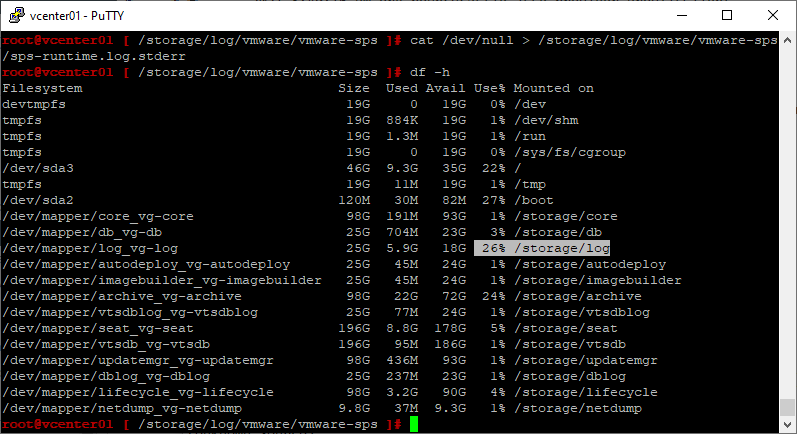
df -hВидим что в /storage/log место утилизировано на 100%. Вычисляем самую толстую директорию:
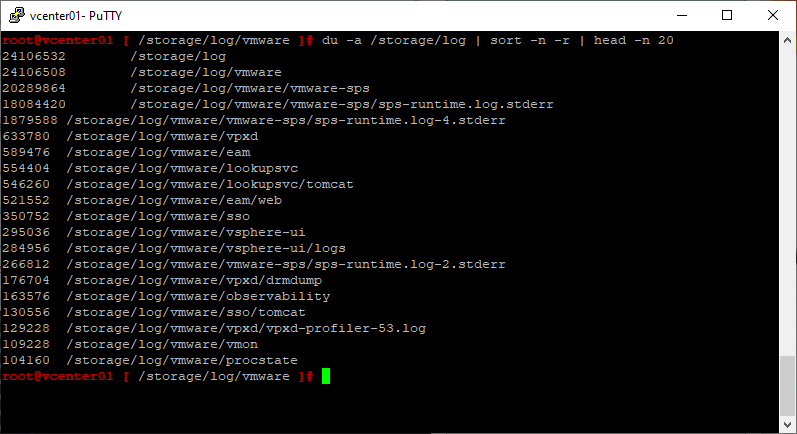
du -h --max-depth=1Или:
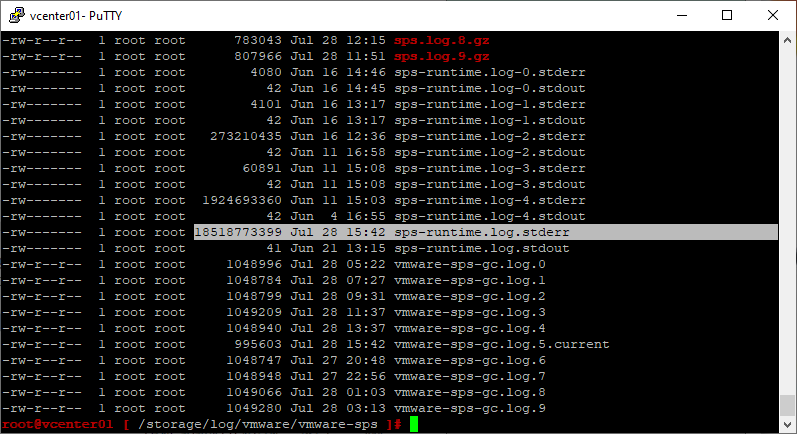
du -a /storage/log | sort -n -r | head -n 20Файл /storage/log/vmware/vmware-sps/sps-runtime.log.stderr занял почти всё место на диске.
Посмотрим что внутри:
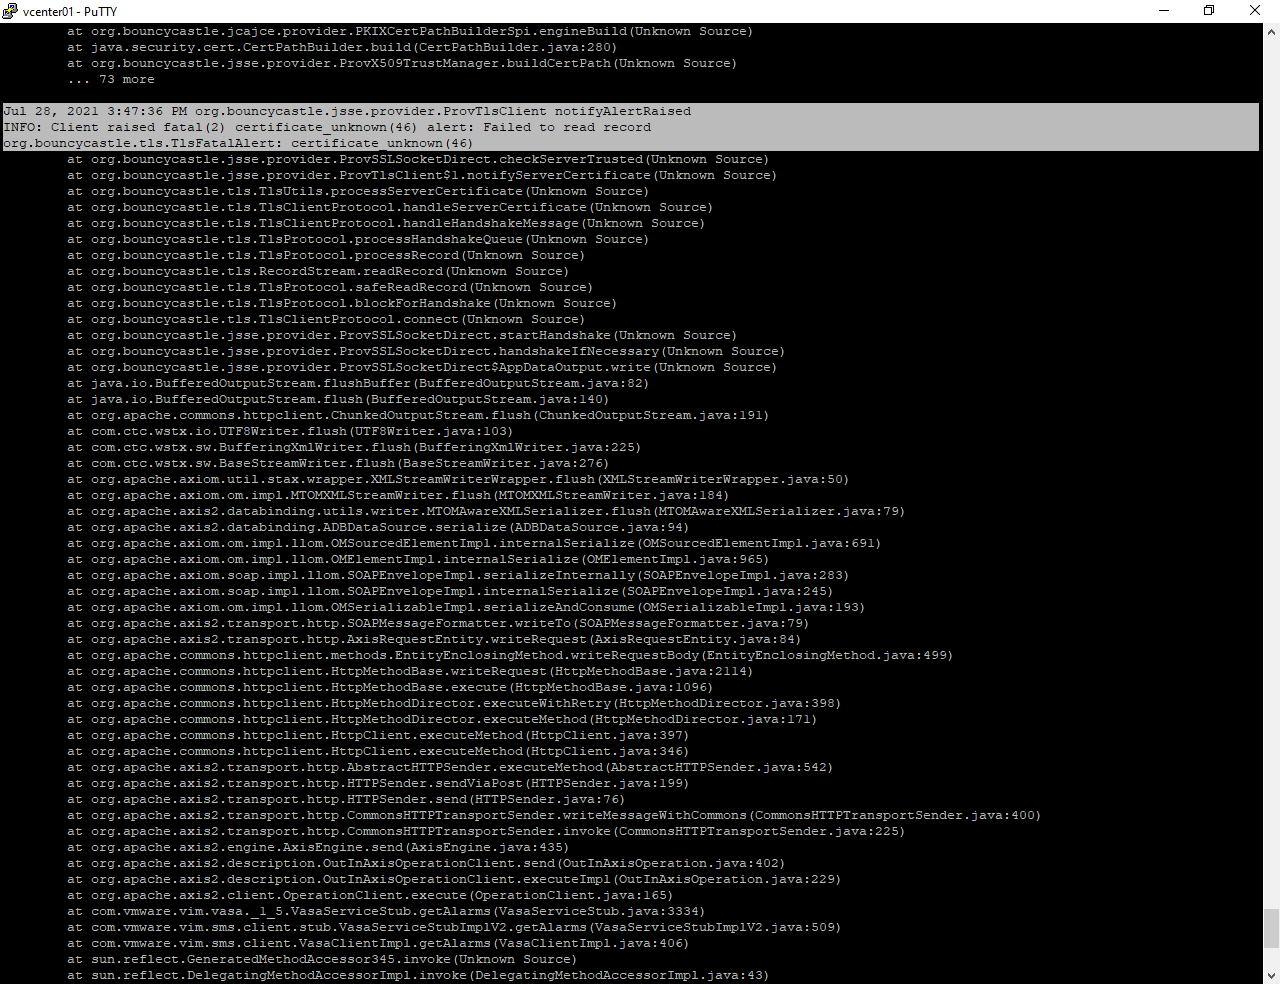
tail -n 1000 /storage/log/vmware/vmware-sps/sps-runtime.log.stderrВнутри всё место забито ошибкой:
org.bouncycastle.jsse.provider.ProvTlsClient notifyAlertRaised
INFO: Client raised fatal(2) certificate_unknown(46) alert: Failed to read record
org.bouncycastle.tls.TlsFatalAlert: certificate_unknown(46)
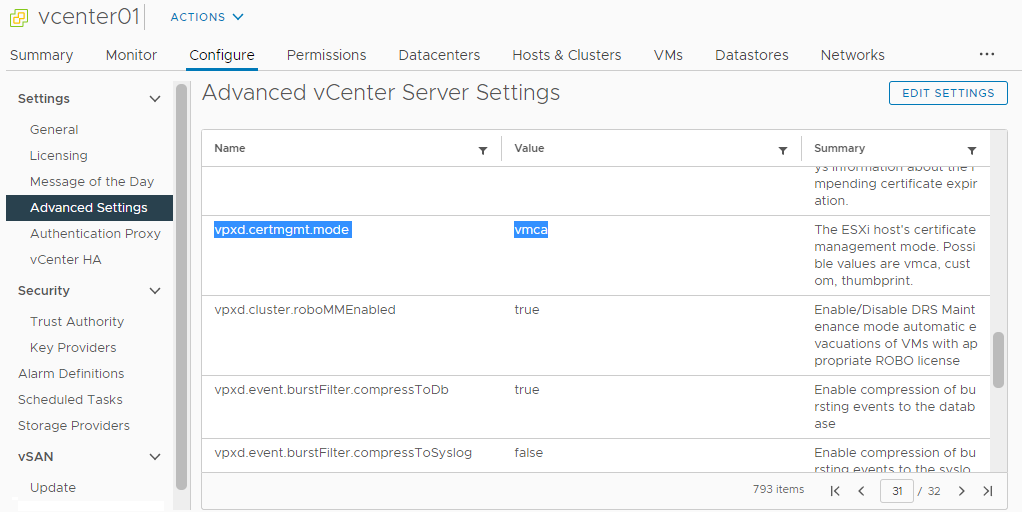
vCenter не доверяет сертификатам некоторых гипервизоров. Это может быть связано с параметром vpxd.certmgmt.mode. Можно установить его значение в vmca, тогда сертификатами хостов будет рулить vCenter. Собственно, это и так значение по умолчанию, но вы могли это значение изменить и управлять сертификатами хостов вручную. Тогда вам нужно разбираться с сертификатами самим.
У меня проблема была связана с тем, что в vCenter был подключен гипервизор от другого vCenter. Естественно, сертификат не распознавался.
Мы немного отвлеклись от темы. Освободим место, почистив файл:
cat /dev/null > /storage/log/vmware/vmware-sps/sps-runtime.log.stderrМесто освободилось.
Следует помнить, что файл /storage/log/vmware/vmware-sps/sps-runtime.log.stderr будет продолжать расти, пока вы не устраните причину ошибки.
Go to vmware
PSC Service Health Alarm. What is it and how might I fix it?
We successfully added a third host to our cluster yesterday and everything appears to be fine and normal with the exception of a «PSC Service Health Alarm» having been triggered.
A quick Google gives this thread but when I try to start the sfcbd-watchdog service on all three hosts, I’m told that it is administratively disabled.
I’m not too sure what it is, where it is set or even if it has ever been set before as we’ve not seen this alarm previously.
We also use Veeam which has a reference to it but that and it’s links don’t prove to be very helpful.
Any pointers would be very welcome…
We successfully added a third host to our cluster yesterday and everything appears to be fine and normal with the exception of a “PSC Service Health Alarm” having been triggered.
A quick Google gives [this](https://communities.vmware.com/thread/602328) thread but when I try to start the sfcbd-watchdog service on all three hosts, I’m told that it is administratively disabled.
I’m not too sure what it is, where it is set or even if it has ever been set before as we’ve not seen this alarm previously.
We also use Veeam which has a [reference](https://helpcenter.veeam.com/docs/mp/kb/psc_service_health.html?ver=80U6) to it but that and it’s links don’t prove to be very helpful.
Any pointers would be very welcome…


