
Простыми словами, трассировка стека – это список методов, которые были вызваны до момента, когда в приложении произошло исключение.
Простой случай
В указанном примере мы можем точно определить, когда именно произошло исключение. Рассмотрим трассировку стека:
Exception in thread "main" java.lang.NullPointerException
       at com.example.myproject.Book.getTitle(Book.java:16)
       at com.example.myproject.Author.getBookTitles(Author.java:25)
       at com.example.myproject.Bootstrap.main(Bootstrap.java:14)
Это пример очень простой трассировки. Если пойти по списку строк вида «at…» с самого начала, мы можем понять, где произошла ошибка. Мы смотрим на верхний вызов функции. В нашем случае, это:
at com.example.myproject.Book.getTitle(Book.java:16)
Для отладки этого фрагмента открываем Book.java и смотрим, что находится на строке 16:
public String getTitle() {
    System.out.println(title.toString()); <-- line 16
    return title;
}
Это означает то, что в приведенном фрагменте кода какая-то переменная (вероятно, title) имеет значение null.
Пример цепочки исключений
Иногда приложения перехватывают исключение и выбрасывают его в виде другого исключения. Обычно это выглядит так:
try {
    ....
} catch (NullPointerException e) {
    throw new IllegalStateException("A book has a null property", e)
}
Трассировка в этом случае может иметь следующий вид:
Exception in thread "main" java.lang.IllegalStateException: A book has a null property
       at com.example.myproject.Author.getBookIds(Author.java:38)
       at com.example.myproject.Bootstrap.main(Bootstrap.java:14)
Caused by: java.lang.NullPointerException
       at com.example.myproject.Book.getId(Book.java:22)
       at com.example.myproject.Author.getBookIds(Author.java:35)
       ... 1 more
В этом случае разница состоит в атрибуте «Caused by» («Чем вызвано»). Иногда исключения могут иметь несколько секций «Caused by». Обычно необходимо найти исходную причину, которой оказывается в самой последней (нижней) секции «Caused by» трассировки. В нашем случае, это:
Caused by: java.lang.NullPointerException <-- root cause
       at com.example.myproject.Book.getId(Book.java:22) <-- important line
Аналогично, при подобном исключении необходимо обратиться к строке 22 книги Book.java, чтобы узнать, что вызвало данное исключение – NullPointerException.
Еще один пугающий пример с библиотечным кодом
Как правило, трассировка имеет гораздо более сложный вид, чем в рассмотренных выше случаях. Приведу пример (длинная трассировка, демонстрирующая несколько уровней цепочек исключений):
javax.servlet.ServletException: Произошло что–то ужасное
   at com.example.myproject.OpenSessionInViewFilter.doFilter(OpenSessionInViewFilter.java:60)
   at org.mortbay.jetty.servlet.ServletHandler$CachedChain.doFilter(ServletHandler.java:1157)
   at com.example.myproject.ExceptionHandlerFilter.doFilter(ExceptionHandlerFilter.java:28)
   at org.mortbay.jetty.servlet.ServletHandler$CachedChain.doFilter(ServletHandler.java:1157)
   at com.example.myproject.OutputBufferFilter.doFilter(OutputBufferFilter.java:33)
   at org.mortbay.jetty.servlet.ServletHandler$CachedChain.doFilter(ServletHandler.java:1157)
   at org.mortbay.jetty.servlet.ServletHandler.handle(ServletHandler.java:388)
   at org.mortbay.jetty.security.SecurityHandler.handle(SecurityHandler.java:216)
   at org.mortbay.jetty.servlet.SessionHandler.handle(SessionHandler.java:182)
   at org.mortbay.jetty.handler.ContextHandler.handle(ContextHandler.java:765)
   at org.mortbay.jetty.webapp.WebAppContext.handle(WebAppContext.java:418)
   at org.mortbay.jetty.handler.HandlerWrapper.handle(HandlerWrapper.java:152)
   at org.mortbay.jetty.Server.handle(Server.java:326)
   at org.mortbay.jetty.HttpConnection.handleRequest(HttpConnection.java:542)
   at org.mortbay.jetty.HttpConnection$RequestHandler.content(HttpConnection.java:943)
   at org.mortbay.jetty.HttpParser.parseNext(HttpParser.java:756)
   at org.mortbay.jetty.HttpParser.parseAvailable(HttpParser.java:218)
   at org.mortbay.jetty.HttpConnection.handle(HttpConnection.java:404)
   at org.mortbay.jetty.bio.SocketConnector$Connection.run(SocketConnector.java:228)
   at org.mortbay.thread.QueuedThreadPool$PoolThread.run(QueuedThreadPool.java:582)
Caused by: com.example.myproject.MyProjectServletException
   at com.example.myproject.MyServlet.doPost(MyServlet.java:169)
   at javax.servlet.http.HttpServlet.service(HttpServlet.java:727)
   at javax.servlet.http.HttpServlet.service(HttpServlet.java:820)
   at org.mortbay.jetty.servlet.ServletHolder.handle(ServletHolder.java:511)
   at org.mortbay.jetty.servlet.ServletHandler$CachedChain.doFilter(ServletHandler.java:1166)
   at com.example.myproject.OpenSessionInViewFilter.doFilter(OpenSessionInViewFilter.java:30)
   ... 27 more
Caused by: org.hibernate.exception.ConstraintViolationException: could not insert: [com.example.myproject.MyEntity]
   at org.hibernate.exception.SQLStateConverter.convert(SQLStateConverter.java:96)
   at org.hibernate.exception.JDBCExceptionHelper.convert(JDBCExceptionHelper.java:66)
   at org.hibernate.id.insert.AbstractSelectingDelegate.performInsert(AbstractSelectingDelegate.java:64)
   at org.hibernate.persister.entity.AbstractEntityPersister.insert(AbstractEntityPersister.java:2329)
   at org.hibernate.persister.entity.AbstractEntityPersister.insert(AbstractEntityPersister.java:2822)
   at org.hibernate.action.EntityIdentityInsertAction.execute(EntityIdentityInsertAction.java:71)
   at org.hibernate.engine.ActionQueue.execute(ActionQueue.java:268)
   at org.hibernate.event.def.AbstractSaveEventListener.performSaveOrReplicate(AbstractSaveEventListener.java:321)
   at org.hibernate.event.def.AbstractSaveEventListener.performSave(AbstractSaveEventListener.java:204)
   at org.hibernate.event.def.AbstractSaveEventListener.saveWithGeneratedId(AbstractSaveEventListener.java:130)
   at org.hibernate.event.def.DefaultSaveOrUpdateEventListener.saveWithGeneratedOrRequestedId(DefaultSaveOrUpdateEventListener.java:210)
   at org.hibernate.event.def.DefaultSaveEventListener.saveWithGeneratedOrRequestedId(DefaultSaveEventListener.java:56)
   at org.hibernate.event.def.DefaultSaveOrUpdateEventListener.entityIsTransient(DefaultSaveOrUpdateEventListener.java:195)
   at org.hibernate.event.def.DefaultSaveEventListener.performSaveOrUpdate(DefaultSaveEventListener.java:50)
   at org.hibernate.event.def.DefaultSaveOrUpdateEventListener.onSaveOrUpdate(DefaultSaveOrUpdateEventListener.java:93)
   at org.hibernate.impl.SessionImpl.fireSave(SessionImpl.java:705)
   at org.hibernate.impl.SessionImpl.save(SessionImpl.java:693)
   at org.hibernate.impl.SessionImpl.save(SessionImpl.java:689)
   at sun.reflect.GeneratedMethodAccessor5.invoke(Unknown Source)
   at sun.reflect.DelegatingMethodAccessorImpl.invoke(DelegatingMethodAccessorImpl.java:25)
   at java.lang.reflect.Method.invoke(Method.java:597)
   at org.hibernate.context.ThreadLocalSessionContext$TransactionProtectionWrapper.invoke(ThreadLocalSessionContext.java:344)
   at $Proxy19.save(Unknown Source)
   at com.example.myproject.MyEntityService.save(MyEntityService.java:59) <-- relevant call (see notes below)
   at com.example.myproject.MyServlet.doPost(MyServlet.java:164)
   ... 32 more
Caused by: java.sql.SQLException: Violation of unique constraint MY_ENTITY_UK_1: duplicate value(s) for column(s) MY_COLUMN in statement [...]
   at org.hsqldb.jdbc.Util.throwError(Unknown Source)
   at org.hsqldb.jdbc.jdbcPreparedStatement.executeUpdate(Unknown Source)
   at com.mchange.v2.c3p0.impl.NewProxyPreparedStatement.executeUpdate(NewProxyPreparedStatement.java:105)
   at org.hibernate.id.insert.AbstractSelectingDelegate.performInsert(AbstractSelectingDelegate.java:57)
   ... 54 more
В этом примере приведен далеко не полный стек вызовов. Что вызывает здесь наибольший интерес, так это поиск функций из нашего кода – из пакета com.example.myproject. В предыдущем примере мы сначала хотели отыскать «первопричину», а именно:
Caused by: java.sql.SQLException
Однако все вызовы методов в данном случае относятся к библиотечному коду. Поэтому мы перейдем к предыдущей секции «Caused by» и найдем первый вызов метода из нашего кода, а именно:
at com.example.myproject.MyEntityService.save(MyEntityService.java:59)
Аналогично предыдущим примерам, необходимо обратить внимание на MyEntityService.java, строка 59: именно здесь появилась ошибка (в данном случае ситуация довольно очевидная, так как об ошибке сообщает SQLException, но в этом вопросе мы рассматриваем именно процедуру отладки с помощью трассировки).
Перевод ответа: «What is a stack trace, and how can I use it to debug my application errors?» @Rob Hruska
Deploying your Java code to production limits your troubleshooting options. Connecting to your app in production with a debugger is usually out of the question, and you might not even be able to get console access. So even with monitoring, you’re going to end up troubleshooting many problems post-mortem. This means looking at logs and, if you’re lucky, working with a Java stack trace.
That’s right, I said you’re lucky if you have a stack trace. It’s like getting a compass, a map, and a first-class airplane ticket handed to you all at once! Let’s talk about what a Java stack trace is and how you can use it.

What’s a Java Stack Trace?
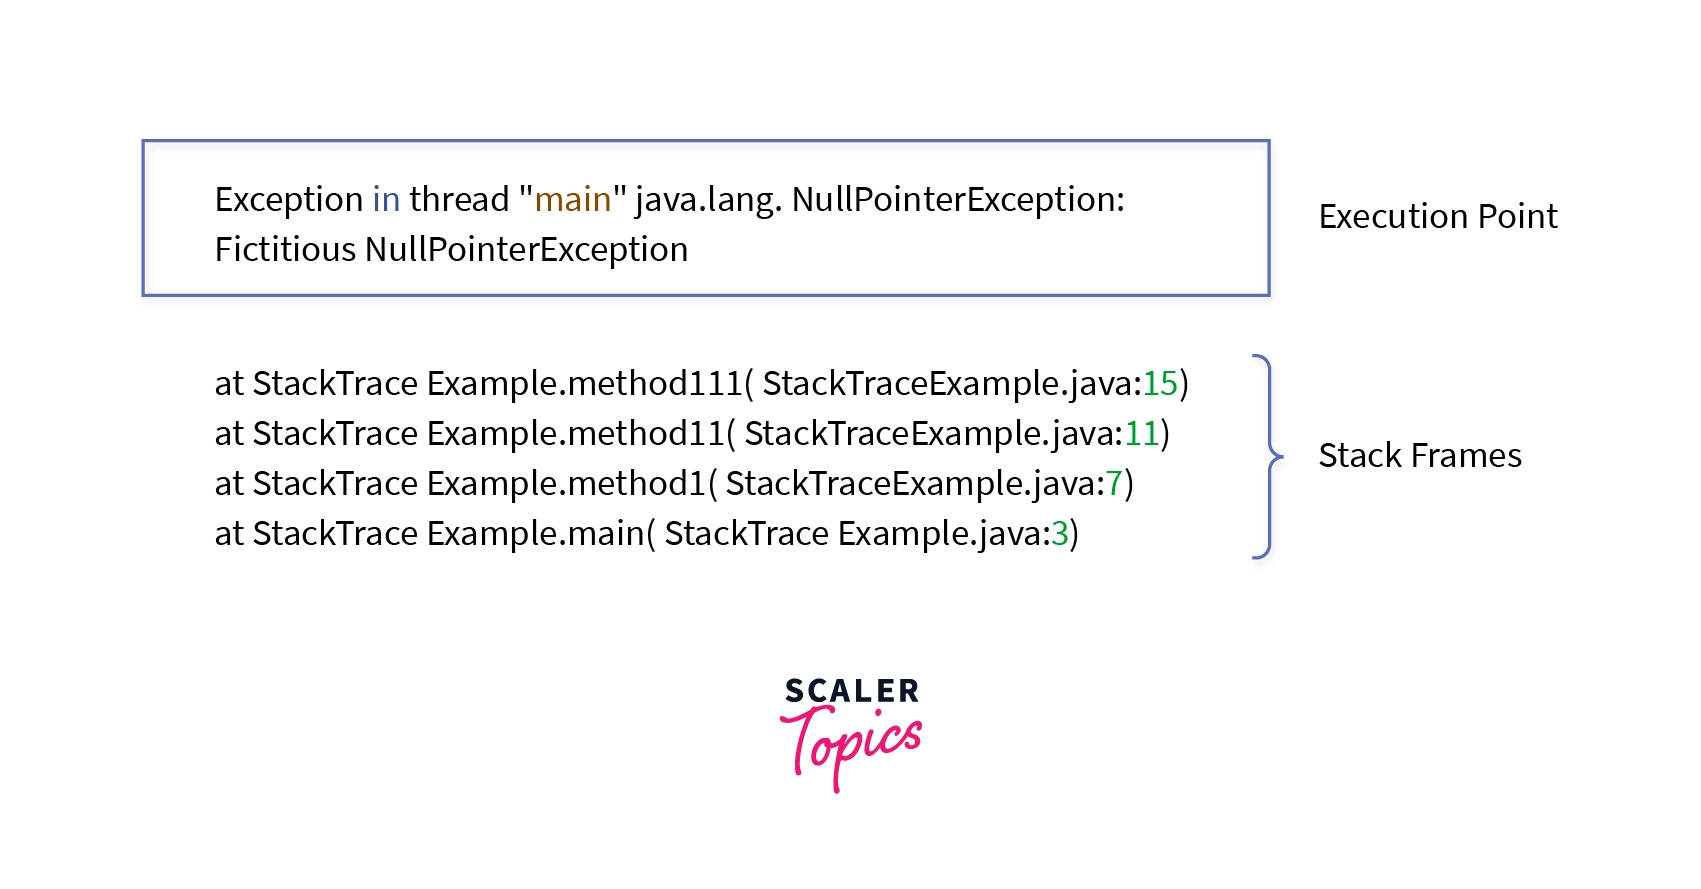
A stack trace, also called a stack backtrace or even just a backtrace, is a list of stack frames. These frames represent a moment during an application’s execution. A stack frame is information about a method or function that your code called. So the Java stack trace is a list of frames that starts at the current method and extends to when the program started.
Sometimes there’s confusion between a stack and the Stack. A stack is a data structure that acts as a stack of papers on your desk: it’s first-in-last-out. You add documents to the pile and take them off in the reverse order you put them there. The Stack, more accurately called the runtime or call stack, is a set of stack frames a program creates as it executes, organized in a stack data structure.
Let’s look at an example.
Java Stack Trace Example
Let’s take a look at a Java program. This class calls four methods and prints a stack trace to the console from the
public class StackTrace {

  public static void main(String[] args) {
    a();
  }

  static void a() {
    b();
  }

  static void b() {
    c();
  }

  static void c() {
    d();
  }

  static void d() {
    Thread.dumpStack();
  }
}
When you run the class, you’ll see something like this:
java.lang.Exception: Stack trace
at java.base/java.lang.Thread.dumpStack(Thread.java:1383)
at com.ericgoebelbecker.stacktraces.StackTrace.d(StackTrace.java:23)
at com.ericgoebelbecker.stacktraces.StackTrace.c(StackTrace.java:19)
at com.ericgoebelbecker.stacktraces.StackTrace.b(StackTrace.java:15)
at com.ericgoebelbecker.stacktraces.StackTrace.a(StackTrace.java:11)
at com.ericgoebelbecker.stacktraces.StackTrace.main(StackTrace.java:7)
The d() method() is at the top of the stack because that’s where the app generated the trace. The main() method is at the bottom because that’s where the program started. When the program started, the Java runtime executed the main() method. Main() called a(). A() called b(), and b() called c(), which called d(). Finally, d() called dumpStack(), which generated the output. This Java stack trace gives us a picture of what the program did, in the order that it did it.
A Java stack trace is a snapshot of a moment in time. You can see where your application was and how it got there. That’s valuable insight that you can use a few different ways.
How to Use Java Stack Traces
Now that you’ve seen what Java stack traces show you, how can you use them?
Java Exceptions
Stack traces and exceptions are often associated with each other. When you see a Java application throw an exception, you usually see a stack trace logged with it. This is because of how exceptions work.
When Java code throws an exception, the runtime looks up the stack for a method that has a handler that can process it. If it finds one, it passes the exception to it. If it doesn’t, the program exits. So exceptions and the call stack are linked directly. Understanding this relationship will help you figure out why your code threw an exception.
Let’s change our sample code.
First, modify the d() method:
static void d() {
  throw new NullPointerException("Oops!");
}
Then, change main() and a() so main can catch an exception. You’ll need to add a checked exception to a() so the code will compile.
public static void main(String[] args)
{
  try {
    a();
  } catch (InvalidClassException ice) {
    System.err.println(ice.getMessage());
  }
}

static void a() throws InvalidClassException
{
  b();
}
You’re deliberately catching the “wrong” exception. Run this code and watch what happens.
Exception in thread "main" java.lang.NullPointerException: Oops!
at com.ericgoebelbecker.stacktraces.StackTrace.d(StackTrace.java:29)
at com.ericgoebelbecker.stacktraces.StackTrace.c(StackTrace.java:24)
at com.ericgoebelbecker.stacktraces.StackTrace.b(StackTrace.java:20)
at com.ericgoebelbecker.stacktraces.StackTrace.a(StackTrace.java:16)
at com.ericgoebelbecker.stacktraces.StackTrace.main(StackTrace.java:9)
The exception bubbled up the stack past main() because you were trying to catch a different exception. So the runtime threw it, terminating the application. You can still see a stack trace though, so it’s easy to determine what happened.
Now, change main() to catch a NullPointerException instead. You can remove the checked exception from a() too.
public static void main(String[] args) {
  try {
    a();
  } catch (NullPointerException ice) {
    System.err.println(ice.getMessage());
  }
}

static void a() {
  b();
}
Rerun the program.
Oops!
We lost the stack trace! By only printing the message attached to the exception, you missed some vital context. Unless you can remember why you wrote Oops! in that message, tracking down this problem is going to be
public static void main(String[] args) {
  try {
    a();
  } catch (NullPointerException npe) {
    npe.printStackTrace();
  }
}
Rerun the application.
java.lang.NullPointerException: Oops!
at com.ericgoebelbecker.stacktraces.StackTrace.d(StackTrace.java:28)
at com.ericgoebelbecker.stacktraces.StackTrace.c(StackTrace.java:24)
at com.ericgoebelbecker.stacktraces.StackTrace.b(StackTrace.java:20)
at com.ericgoebelbecker.stacktraces.StackTrace.a(StackTrace.java:16)
at com.ericgoebelbecker.stacktraces.StackTrace.main(StackTrace.java:9)
That’s better! We see the stack trace, and it ends at d() where the exception occurred, even though main() printed it.
Logging Java Stack Traces
What if you don’t want to print an error message to the console but to a log file instead? The good news is that most loggers, including Log4j and Logback, will write exceptions with stack traces if you call them with the right arguments.
Pass in the exception object as the last argument to the message, without a formatting directive. So if you used Log4j or Logback with the sample code like this:
logger.error(“Something bad happened:”, npe);
You would see this in your log file:
Something bad happened:
java.lang.NullPointerException: Oops!
at com.ericgoebelbecker.stacktraces.StackTrace.d(StackTrace.java:28)
at com.ericgoebelbecker.stacktraces.StackTrace.c(StackTrace.java:24)
at com.ericgoebelbecker.stacktraces.StackTrace.b(StackTrace.java:20)
at com.ericgoebelbecker.stacktraces.StackTrace.a(StackTrace.java:16)
at com.ericgoebelbecker.stacktraces.StackTrace.main(StackTrace.java:9)
One of the best things you can do with exceptions and stack traces is to log them so you can use them to isolate a problem. If you get in the habit of printing useful log messages with details like stack traces and log indexing, then search tools, like Scalyr, become one of the most powerful tools in your troubleshooting tool bag.
The Java Debugger
Debuggers work by taking control of a program’s runtime and letting you both observe and control it. To do this, it shows you the program stack and enables you to traverse it in either direction. When you’re in a debugger, you get a more complete picture of a stack frame than you do when looking at stack traces in a log message.
Let’s make a small code change and then throw the sample code into a debugger.
First, add a local variable to the d() method:
static void d() {
  String message = “Oops.”
  throw new NullPointerException(message);
}
Then add a breakpoint where d() throws the exception in your debugger. I’m using IntelliJ’s debugger for this image.
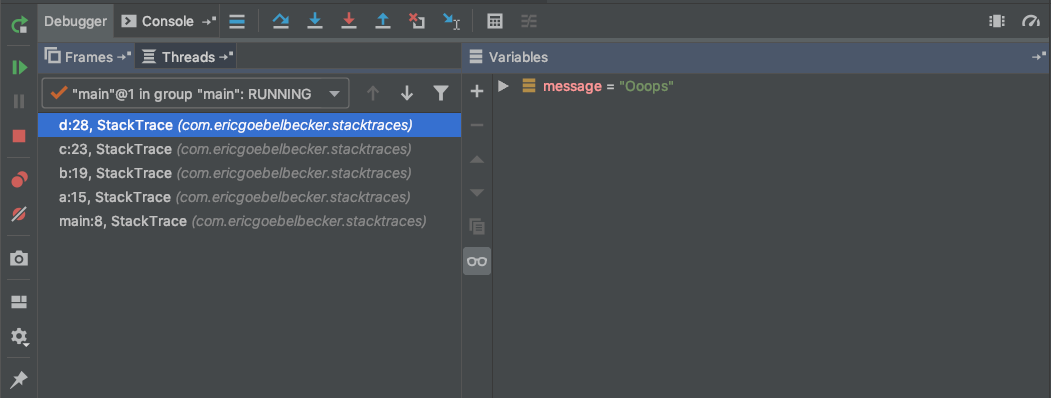
Here you can see that the string we added to d() is part of the stack frame because it’s a local variable. Debuggers operate inside the Stack and give you a detailed picture of each frame.
Forcing a Thread Dump
Thread dumps are great post-mortem tools, but they can be useful for runtime issues too. If your application stops responding or is consuming more CPU or memory than you expect, you can retrieve information about the running app with jstack.
Modify main() so the application will run until killed:
public static void main(String[] args) throws Exception {
  try {
      while(true) {
          Thread.sleep(1000);
      }
  } catch (NullPointerException ice)  {
      ice.printStackTrace();
  }
}
Run the app, determine its pid, and then run jstack. On Windows, you’ll need to press ctrl-break in the DOS window you’re running your code in.
$ jstack <pid>
Jstack will generate a lot of output.
2019-05-13 10:06:17
Full thread dump OpenJDK 64-Bit Server VM (12+33 mixed mode, sharing):

Threads class SMR info:
_java_thread_list=0x00007f8bb2727190, length=10, elements={
0x00007f8bb3807000, 0x00007f8bb2875000, 0x00007f8bb2878000, 0x00007f8bb4000800,
0x00007f8bb300a800, 0x00007f8bb287b800, 0x00007f8bb287f000, 0x00007f8bb28ff800,
0x00007f8bb300b800, 0x00007f8bb3805000
}

"main" #1 prio=5 os_prio=31 cpu=60.42ms elapsed=103.32s tid=0x00007f8bb3807000 nid=0x2503 waiting on condition  [0x0000700001a0e000]
   java.lang.Thread.State: TIMED_WAITING (sleeping)
	at java.lang.Thread.sleep([email protected]/Native Method)
	at com.ericgoebelbecker.stacktraces.StackTrace.main(StackTrace.java:9)

"Reference Handler" #2 daemon prio=10 os_prio=31 cpu=0.08ms elapsed=103.29s tid=0x00007f8bb2875000 nid=0x4603 waiting on condition  [0x0000700002123000]
   java.lang.Thread.State: RUNNABLE
	at java.lang.ref.Reference.waitForReferencePendingList([email protected]/Native Method)
	at java.lang.ref.Reference.processPendingReferences([email protected]/Reference.java:241)
	at java.lang.ref.Reference$ReferenceHandler.run([email protected]/Reference.java:213)

"Finalizer" #3 daemon prio=8 os_prio=31 cpu=0.13ms elapsed=103.29s tid=0x00007f8bb2878000 nid=0x3903 in Object.wait()  [0x0000700002226000]
   java.lang.Thread.State: WAITING (on object monitor)
	at java.lang.Object.wait([email protected]/Native Method)
	- waiting on <0x000000070ff02770> (a java.lang.ref.ReferenceQueue$Lock)
	at java.lang.ref.ReferenceQueue.remove([email protected]/ReferenceQueue.java:155)
	- locked <0x000000070ff02770> (a java.lang.ref.ReferenceQueue$Lock)
	at java.lang.ref.ReferenceQueue.remove([email protected]/ReferenceQueue.java:176)
	at java.lang.ref.Finalizer$FinalizerThread.run([email protected]/Finalizer.java:170)

"Signal Dispatcher" #4 daemon prio=9 os_prio=31 cpu=0.27ms elapsed=103.28s tid=0x00007f8bb4000800 nid=0x3e03 runnable  [0x0000000000000000]
   java.lang.Thread.State: RUNNABLE

"C2 CompilerThread0" #5 daemon prio=9 os_prio=31 cpu=6.12ms elapsed=103.28s tid=0x00007f8bb300a800 nid=0x5603 waiting on condition  [0x0000000000000000]
   java.lang.Thread.State: RUNNABLE
   No compile task

"C1 CompilerThread0" #7 daemon prio=9 os_prio=31 cpu=12.01ms elapsed=103.28s tid=0x00007f8bb287b800 nid=0xa803 waiting on condition  [0x0000000000000000]
   java.lang.Thread.State: RUNNABLE
   No compile task

"Sweeper thread" #8 daemon prio=9 os_prio=31 cpu=0.73ms elapsed=103.28s tid=0x00007f8bb287f000 nid=0xa603 runnable  [0x0000000000000000]
   java.lang.Thread.State: RUNNABLE

"Service Thread" #9 daemon prio=9 os_prio=31 cpu=0.04ms elapsed=103.27s tid=0x00007f8bb28ff800 nid=0xa503 runnable  [0x0000000000000000]
   java.lang.Thread.State: RUNNABLE

"Common-Cleaner" #10 daemon prio=8 os_prio=31 cpu=0.27ms elapsed=103.27s tid=0x00007f8bb300b800 nid=0xa303 in Object.wait()  [0x000070000293b000]
   java.lang.Thread.State: TIMED_WAITING (on object monitor)
	at java.lang.Object.wait([email protected]/Native Method)
	- waiting on <0x000000070ff91690> (a java.lang.ref.ReferenceQueue$Lock)
	at java.lang.ref.ReferenceQueue.remove([email protected]/ReferenceQueue.java:155)
	- locked <0x000000070ff91690> (a java.lang.ref.ReferenceQueue$Lock)
	at jdk.internal.ref.CleanerImpl.run([email protected]/CleanerImpl.java:148)
	at java.lang.Thread.run([email protected]/Thread.java:835)
	at jdk.internal.misc.InnocuousThread.run([email protected]/InnocuousThread.java:134)

"Attach Listener" #11 daemon prio=9 os_prio=31 cpu=0.72ms elapsed=0.10s tid=0x00007f8bb3805000 nid=0x5e03 waiting on condition  [0x0000000000000000]
   java.lang.Thread.State: RUNNABLE

"VM Thread" os_prio=31 cpu=3.83ms elapsed=103.29s tid=0x00007f8bb2874800 nid=0x3703 runnable

"GC Thread#0" os_prio=31 cpu=0.13ms elapsed=103.31s tid=0x00007f8bb282b800 nid=0x3003 runnable

"G1 Main Marker" os_prio=31 cpu=0.26ms elapsed=103.31s tid=0x00007f8bb2845000 nid=0x3103 runnable

"G1 Conc#0" os_prio=31 cpu=0.04ms elapsed=103.31s tid=0x00007f8bb3810000 nid=0x3303 runnable

"G1 Refine#0" os_prio=31 cpu=0.39ms elapsed=103.31s tid=0x00007f8bb2871000 nid=0x3403 runnable

"G1 Young RemSet Sampling" os_prio=31 cpu=13.60ms elapsed=103.31s tid=0x00007f8bb2872000 nid=0x4d03 runnable
"VM Periodic Task Thread" os_prio=31 cpu=66.44ms elapsed=103.27s tid=0x00007f8bb2900800 nid=0xa403 waiting on condition

JNI global refs: 5, weak refs: 0
My application was running 11 threads, and jstack generated a stack trace for all of them. The first thread, helpfully named main, is the one we’re concerned with. You can see it sleeping on wait().
Java Stack Traces: Your Roadmap
A stack trace is more than just a picture inside your application. It’s a snapshot of a moment in time that includes every step your code took to get there. There’s no reason to dread seeing one in your logs because they’re a gift from Java that tells you exactly what happened. Make sure you’re logging them when an error crops up and send them to a tool like Scalyr so they’re easy to find.
Now that you understand what a Java stack trace is and how to use it, take a look at your code. Are you throwing away critical information about errors and exceptions in your code? Is there a spot where a call to Thread.dumpstack() might help you isolate a recurring bug? Perhaps it’s time to run your app through the debugger a few times with some strategically-chosen breakpoints.
In simple terms, a stack trace is a list of the method calls that the application was in the middle of when an Exception was thrown.
Simple Example
With the example given in the question, we can determine exactly where the exception was thrown in the application. Let’s have a look at the stack trace:
Exception in thread "main" java.lang.NullPointerException
        at com.example.myproject.Book.getTitle(Book.java:16)
        at com.example.myproject.Author.getBookTitles(Author.java:25)
        at com.example.myproject.Bootstrap.main(Bootstrap.java:14)
This is a very simple stack trace. If we start at the beginning of the list of «at …», we can tell where our error happened. What we’re looking for is the topmost method call that is part of our application. In this case, it’s:
at com.example.myproject.Book.getTitle(Book.java:16)
To debug this, we can open up Book.java and look at line 16, which is:
15   public String getTitle() {
16      System.out.println(title.toString());
17      return title;
18   }
This would indicate that something (probably title) is null in the above code.
Example with a chain of exceptions
Sometimes applications will catch an Exception and re-throw it as the cause of another Exception. This typically looks like:
34   public void getBookIds(int id) {
35      try {
36         book.getId(id);    // this method it throws a NullPointerException on line 22
37      } catch (NullPointerException e) {
38         throw new IllegalStateException("A book has a null property", e)
39      }
40   }
This might give you a stack trace that looks like:
Exception in thread "main" java.lang.IllegalStateException: A book has a null property
        at com.example.myproject.Author.getBookIds(Author.java:38)
        at com.example.myproject.Bootstrap.main(Bootstrap.java:14)
Caused by: java.lang.NullPointerException
        at com.example.myproject.Book.getId(Book.java:22)
        at com.example.myproject.Author.getBookIds(Author.java:36)
        ... 1 more
What’s different about this one is the «Caused by». Sometimes exceptions will have multiple «Caused by» sections. For these, you typically want to find the «root cause», which will be one of the lowest «Caused by» sections in the stack trace. In our case, it’s:
Caused by: java.lang.NullPointerException <-- root cause
        at com.example.myproject.Book.getId(Book.java:22) <-- important line
Again, with this exception we’d want to look at line 22 of Book.java to see what might cause the NullPointerException here.
More daunting example with library code
Usually stack traces are much more complex than the two examples above. Here’s an example (it’s a long one, but demonstrates several levels of chained exceptions):
javax.servlet.ServletException: Something bad happened
    at com.example.myproject.OpenSessionInViewFilter.doFilter(OpenSessionInViewFilter.java:60)
    at org.mortbay.jetty.servlet.ServletHandler$CachedChain.doFilter(ServletHandler.java:1157)
    at com.example.myproject.ExceptionHandlerFilter.doFilter(ExceptionHandlerFilter.java:28)
    at org.mortbay.jetty.servlet.ServletHandler$CachedChain.doFilter(ServletHandler.java:1157)
    at com.example.myproject.OutputBufferFilter.doFilter(OutputBufferFilter.java:33)
    at org.mortbay.jetty.servlet.ServletHandler$CachedChain.doFilter(ServletHandler.java:1157)
    at org.mortbay.jetty.servlet.ServletHandler.handle(ServletHandler.java:388)
    at org.mortbay.jetty.security.SecurityHandler.handle(SecurityHandler.java:216)
    at org.mortbay.jetty.servlet.SessionHandler.handle(SessionHandler.java:182)
    at org.mortbay.jetty.handler.ContextHandler.handle(ContextHandler.java:765)
    at org.mortbay.jetty.webapp.WebAppContext.handle(WebAppContext.java:418)
    at org.mortbay.jetty.handler.HandlerWrapper.handle(HandlerWrapper.java:152)
    at org.mortbay.jetty.Server.handle(Server.java:326)
    at org.mortbay.jetty.HttpConnection.handleRequest(HttpConnection.java:542)
    at org.mortbay.jetty.HttpConnection$RequestHandler.content(HttpConnection.java:943)
    at org.mortbay.jetty.HttpParser.parseNext(HttpParser.java:756)
    at org.mortbay.jetty.HttpParser.parseAvailable(HttpParser.java:218)
    at org.mortbay.jetty.HttpConnection.handle(HttpConnection.java:404)
    at org.mortbay.jetty.bio.SocketConnector$Connection.run(SocketConnector.java:228)
    at org.mortbay.thread.QueuedThreadPool$PoolThread.run(QueuedThreadPool.java:582)
Caused by: com.example.myproject.MyProjectServletException
    at com.example.myproject.MyServlet.doPost(MyServlet.java:169)
    at javax.servlet.http.HttpServlet.service(HttpServlet.java:727)
    at javax.servlet.http.HttpServlet.service(HttpServlet.java:820)
    at org.mortbay.jetty.servlet.ServletHolder.handle(ServletHolder.java:511)
    at org.mortbay.jetty.servlet.ServletHandler$CachedChain.doFilter(ServletHandler.java:1166)
    at com.example.myproject.OpenSessionInViewFilter.doFilter(OpenSessionInViewFilter.java:30)
    ... 27 more
Caused by: org.hibernate.exception.ConstraintViolationException: could not insert: [com.example.myproject.MyEntity]
    at org.hibernate.exception.SQLStateConverter.convert(SQLStateConverter.java:96)
    at org.hibernate.exception.JDBCExceptionHelper.convert(JDBCExceptionHelper.java:66)
    at org.hibernate.id.insert.AbstractSelectingDelegate.performInsert(AbstractSelectingDelegate.java:64)
    at org.hibernate.persister.entity.AbstractEntityPersister.insert(AbstractEntityPersister.java:2329)
    at org.hibernate.persister.entity.AbstractEntityPersister.insert(AbstractEntityPersister.java:2822)
    at org.hibernate.action.EntityIdentityInsertAction.execute(EntityIdentityInsertAction.java:71)
    at org.hibernate.engine.ActionQueue.execute(ActionQueue.java:268)
    at org.hibernate.event.def.AbstractSaveEventListener.performSaveOrReplicate(AbstractSaveEventListener.java:321)
    at org.hibernate.event.def.AbstractSaveEventListener.performSave(AbstractSaveEventListener.java:204)
    at org.hibernate.event.def.AbstractSaveEventListener.saveWithGeneratedId(AbstractSaveEventListener.java:130)
    at org.hibernate.event.def.DefaultSaveOrUpdateEventListener.saveWithGeneratedOrRequestedId(DefaultSaveOrUpdateEventListener.java:210)
    at org.hibernate.event.def.DefaultSaveEventListener.saveWithGeneratedOrRequestedId(DefaultSaveEventListener.java:56)
    at org.hibernate.event.def.DefaultSaveOrUpdateEventListener.entityIsTransient(DefaultSaveOrUpdateEventListener.java:195)
    at org.hibernate.event.def.DefaultSaveEventListener.performSaveOrUpdate(DefaultSaveEventListener.java:50)
    at org.hibernate.event.def.DefaultSaveOrUpdateEventListener.onSaveOrUpdate(DefaultSaveOrUpdateEventListener.java:93)
    at org.hibernate.impl.SessionImpl.fireSave(SessionImpl.java:705)
    at org.hibernate.impl.SessionImpl.save(SessionImpl.java:693)
    at org.hibernate.impl.SessionImpl.save(SessionImpl.java:689)
    at sun.reflect.GeneratedMethodAccessor5.invoke(Unknown Source)
    at sun.reflect.DelegatingMethodAccessorImpl.invoke(DelegatingMethodAccessorImpl.java:25)
    at java.lang.reflect.Method.invoke(Method.java:597)
    at org.hibernate.context.ThreadLocalSessionContext$TransactionProtectionWrapper.invoke(ThreadLocalSessionContext.java:344)
    at $Proxy19.save(Unknown Source)
    at com.example.myproject.MyEntityService.save(MyEntityService.java:59) <-- relevant call (see notes below)
    at com.example.myproject.MyServlet.doPost(MyServlet.java:164)
    ... 32 more
Caused by: java.sql.SQLException: Violation of unique constraint MY_ENTITY_UK_1: duplicate value(s) for column(s) MY_COLUMN in statement [...]
    at org.hsqldb.jdbc.Util.throwError(Unknown Source)
    at org.hsqldb.jdbc.jdbcPreparedStatement.executeUpdate(Unknown Source)
    at com.mchange.v2.c3p0.impl.NewProxyPreparedStatement.executeUpdate(NewProxyPreparedStatement.java:105)
    at org.hibernate.id.insert.AbstractSelectingDelegate.performInsert(AbstractSelectingDelegate.java:57)
    ... 54 more
In this example, there’s a lot more. What we’re mostly concerned about is looking for methods that are from our code, which would be anything in the com.example.myproject package. From the second example (above), we’d first want to look down for the root cause, which is:
Caused by: java.sql.SQLException
However, all the method calls under that are library code. So we’ll move up to the «Caused by» above it, and in that «Caused by» block, look for the first method call originating from our code, which is:
at com.example.myproject.MyEntityService.save(MyEntityService.java:59)
Like in previous examples, we should look at MyEntityService.java on line 59, because that’s where this error originated (this one’s a bit obvious what went wrong, since the SQLException states the error, but the debugging procedure is what we’re after).
Overview
A Stack Trace in Java is nothing but a list of all the method calls that a program has executed till the point an error was thrown. It is automatically generated when an exception occurs in the code. Stack Trace known as Stack Backtrace is an array of stack frames. The stack frames represent the development of an application during the execution of the program. Stack trace is a top-down representation of all things that have been allocated or all the memory executions that a program has done until it reached the error case.
Scope of Article
- This article will help you gain a deep understanding of Java Stack Trace.
- We will learn how to read and use Java Stack Trace.
Introduction of Stack Trace in Java
Imagine running into some error in your code and your program suddenly stops without throwing any exceptions or errors. It behaves like a black box where one doesn’t have any idea what went wrong, for what reason, or where to even start looking. One can get easily get lost with no hint of what to do!
This is when Stack trace comes into the picture. It is one of the most useful things in programming. Understanding how stack trace works are critical in order to effectively debug our code.
A Stack Trace is a representation of a call stack. A call stack or runtime stack is a set of stack frames a program creates as it executes, organized in a stack data structure. It contains information on the methods/functions that our program called.
What is Stack Trace in Java?
Stack trace in Java is a list of frames that starts at the current method and extends to when the program started. It gathers the information of all the methods that are called by a program. It is basically our program’s attempt to tell what all functions have been called up until the point where our program produced an error. Whenever unhandled exceptions are thrown, stack traces are simply printed to the console by default.
To print the exceptions that crashed our program, we have a method called printstackTrace(). This method is found in Java’s throwable class. Throwable is super-class for all exception classes. It shows throwable Exception object as well as other Information like the line number where the Exception occurs and the class name where the exception occurred. It is discussed in detail in a later section of the article.
After the launch of Java 1.5, stack trace got encapsulated into an array of a Java class called StackTraceElement.
The StackTraceElement class facilitates a constructor that accepts four parameters as arguments and builds a stack trace element that represents the specified execution point.
The Four Parameters of Stack Trace in Java
-
declaringClass: The name of the class that contains the execution point.
-
methodName: It denotes the method name that contains the execution point.
-
fileName: It denotes the file name that contains the execution point.
-
lineNumber: It denotes the line number of the source of the execution point.
Let’s look at one Example:
Output:
We got the execution point in the first line, and from the second to the end line, we got stack frames that form the complete stack trace. The main() method is at the bottom because that’s where the program started. As the program started, first, the main() method was executed. The main() method called demo(). demo() called demo1(), demo1() called demo2(), demo2() called demo3(), and demo3() finally called dumpStack(), The dumpStack() method of thread class prints the stack trace of the current thread (thread is the path followed when executing a program) to the standard error stream.
A java stack trace is like a snapshot of a moment in time. It tells where our program was and how it reached there.
How to Use Stack Traces in Java?
We now know what Java Stack Traces are! Let’s learn how to use them.
1. Java Exceptions
Exceptions and Stack Traces are intertwined with each other. Whenever our program throws an exception, a stack trace is associated with it. As soon as our code produces an exception, the runtime checks the stack for a handler to handle the exception. If it doesn’t find one then the program exits.
Below are three ways listed to handle exception messages in Java:
- java.lang.Throwable.printStackTrace() method: This method returns the name of the exception and description of the exception separated by a colon, and stack trace in the following lines.
Syntax:
For Example:
Output:
- toString() method: This method will only return the name and description of the Exception.
Syntax:
Example:
Output:
- java.lang.Throwable.getMessage() method: This method only returns the description of the Exception.
Syntax:
Example:
Output:
2. Logging Java Stack Traces
Logging is the method of listing log messages during the execution of a program to get error and warning messages as well as info messages. It is a powerful tool for debugging program’s run-time behavior.
The java.util.logging package lends the logging capabilities using the Logger class. Popular logging frameworks like Log4j, Logback, etc. will write exceptions with stack traces when called with the right arguments. Java Exception object will be passed as the last argument to the message like the sample code below:
where exception is the Java Exception object. It will print the stack trace of the Java Throwable object.
3. The Java Debugger
A debugger is a powerful tool that fixes bugs faster by providing an insight into the internal operations of a program. It displays the program stack and allows us to traverse it in either direction. It gives a more complete picture of the stack frame.
For Example:
Output:
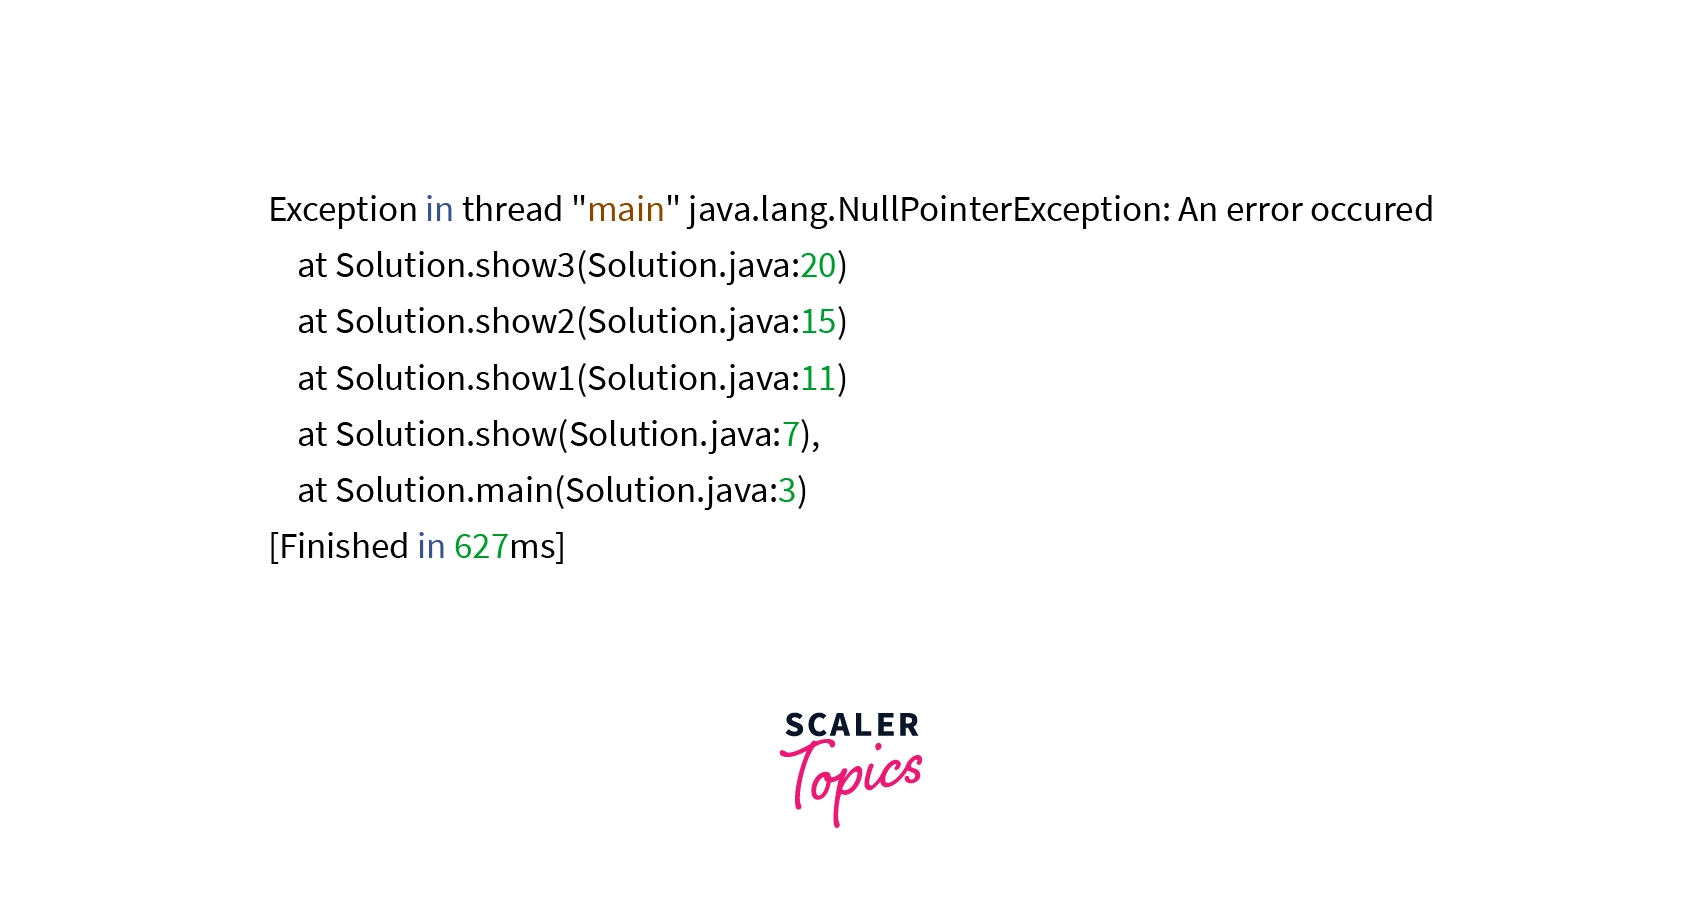
Here show3() throws the exception in debugger.
4. Forcing a Thread Dump
A thread dump is a complete picture of the state of all threads that are a part of the process. The state of each thread is represented by a stack trace, which displays the contents of a thread’s stack. If our application stops responding or is consuming more CPU or memory than expected, then we can get information about the running app using jstack. jstack is a command line utility used in troubleshooting.
Determine the ProcessID of the running app and run jstack. On windows, press ctrl+break in DOS window to capture thread dump.
Syntax: For capturing thread dump
It displays thread dump in the console.
How to Read a Java Stack Trace?
Let’s know how to read a Java Stack Trace.
The first line informs about the Exception. It states the reason for the Exception in the code, and for more information about the cause of that exception, we need to search and read the lines below move, and the main cause can many times be found near the bottom of the stack trace.
Here, in the first line, main specifies the name of the thread where the Exception occurred. java.lang.RuntimeException is the type of exception that was thrown which is followed by a message that may be inscribed in the code by the developer.
The following line shows the state of code at the time when the exception occurred. Reading the stack trace from bottom to top, we can know the exact path from the beginning of the code right to the exception.
What Triggered the Stack Trace?
Stack trace is triggered as soon as our program detects an Exception. An Exception is generally a plain throw statement.
Run-time exceptions can be thrown without a throw statement in cases like NullPointerException, ArithmeticException, ArrayIndexOutOfBoundsException, OutOfMemoryError and many more.
Dealing with Exception Thrown by Libraries
Java has a powerful library set. When Exceptions are thrown, which are from the library, we must check if the error occurred because of how the code used it.
Take an example:
If Bars is zero, then output will be something like this:
In this Example:
Fraction.getFractionthrew an ArithmeticException as it has a zero denominator. In the stack trace, the first line talks about the type of Exception ArithmeticException and contains the message: The denominator must not be zero. It clearly tells what could have gone wrong and the below lines talks about the line number which caused the Exception.
Some libraries have Javadoc which includes information about the kinds of exceptions that may be thrown and why.
The Stack Walking API
The Stack Walking API lends a versatile mechanism to traverse and extract information from call stacks. In simple words, it has the capability to walk through a stack in Java. It was a powerful feature introduced in Java 9. Stack Walker provides a snapshot of the current thread stack along with some methods to access it.
1. Drawbacks of StackTraceElement
A StackTraceElement object provides more information than a single line of the Stack trace. However, all the data is in simple form i.e. a String or a primitive value, it can’t reference a Class object. Hence it becomes very difficult to use information from a stack trace in the program.
Another disadvantage in the old way of retrieving stack frames is that unwanted stack frames cannot be ignored. Moreover, some important elements may get lost as JVM skips some frames for enhanced performance. Hence, there are chances that some useful elements can get lost and unwanted elements remain.
2. The Stack Walking API to the Rescue
Stack Walking API has many benefits which shadow the drawbacks of StackTraceElement object:
-
It provides a way to skip classes, which in turn allows us to process our interest-specific classes.
-
It provides a way to load only certain frames to tackle performance issues.
-
It provides a way to understand application behavior more easily.
This API works around the StackWalker class, which encloses two inner types: StackFrame and Option.
3. Stack Frames
An instance of the StackFrame interface represents an individual frame in a stack. There is an important API that makes StackFrame a better choice than StackTraceElement called getDeclaringClass. This method returns a Class instance, enabling us to perform more complex operations than one could do with a simple class name. However, this is only applicable if the stack walker is set up to retain Class objects.
4. Stack Walker Options
It is a static nested class of StackWalker. The stack walking options of a StackWalker determines the information of StackFrame objects to be returned.
Here’s a complete list of its constants:
-
RETAIN_CLASS_REFERENCE: retains the Class object in each stack frame during a stack walk.
-
SHOW_REFLECT_FRAMES: Shows all reflection frames.
-
SHOW_HIDDEN_FRAMES : shows all hidden frames, including reflection frames.
5. The StackWalker Class
The StackWalker is the main class of StackWalker API. We create its objects, using overloading static methods named getInstance. We walk through stack traces and apply a Function to the stream of Stack Frames using StackWalker.walk() method.
6. Stack Walking with No Options
No-option StackWalker walks through the call stack retaining only frames that are of interest and returns them as a list.
The above example will return a list consisting of methods whose class has a name starting with com.stacktrace.
Benefits of Stack Trace in Java
-
Java stack trace aids in figuring out the Exception thrown by our code.
-
It provides information on the methods that our code called.
-
It is a very useful debugging tool.
-
It is our program’s attempt to tell what all functions have been called up until the point where our program produced an error.
Conclusion
- Stack Trace, also known as Stack Backtrace is an array of stack frames. It is generated when an exception occurs in the code.
- A call stack or runtime stack is a set of stack frames a program creates as it executes, organized in a stack data structure.
- Stack trace is a top-down representation of all things that have been allocated or all the memory executions that a program has done until it reached the error case.
- The Stack Walking API lends a versatile mechanism to traverse and extract information from call stacks.
A Java stack trace is displayed when an error or exception occurs. The stack trace, also called a backtrace, consists of a collection of stack records, which store an application’s movement during its execution.
The stack trace includes information about program subroutines and can be used to debug or troubleshoot and is often used to create log files. These exceptions could be custom (defined by the user) or built-in. Examples include RuntimeException,NullPointerException, andArrayIndexOutofBoundsException.
Now that you know what a stack trace is, let’s take a look at some examples, how to analyze stack traces, and how you can avoid a stack trace altogether with error handling.
Examples of Java Stack Traces
Example 1 — Temperature Conversion from Celsius to Fahrenheit
Let’s look at an example of converting temperatures from Celsius to Fahrenheit. Only an integer or float input is valid here. But if we try to provide another data type, such as a string, the compiler will throw an exception and print the stack trace.
import java.util.Scanner;

public class hello{
    public static void main(String[] args) {
        Scanner scanner = new Scanner(System.in);

        System.out.print("Enter value in Celsius to convert in fahrenheit:");

        double Celsius = scanner.nextFloat();
        double fahrenheit = (Celsius * 1.8)+32;

        System.out.printf("%.1f degrees Celsuis is %.1f degrees in Fahrenheit ",Celsius,fahrenheit);
    }
}
When we run the above code and enter some invalid value, let’s say the string «hero,» we get the following output:
Enter value in Celsius to convert in fahrenheit: hero
Exception in thread "main" java.util.InputMismatchException
    at java.base/java.util.Scanner.throwFor(Scanner.java:939)
    at java.base/java.util.Scanner.next(Scanner.java:1594)
    at java.base/java.util.Scanner.nextFloat(Scanner.java:2496)
    at com.example.myJavaProject.hello.main(hello.java:12)
Example 2 — Function Chaining
This is an example of function chaining, in which one function calls another in a chain-like fashion. Unlike in Example 1, no exception is thrown here, but the stack trace is explicitly printed using the dumpstack() method (a useful method when creating log files). This is good practice because we can use this code later for maintenance or to check the overall health or condition of the application.
public class Example {
   public static void main(String args[]) {
       f1();
   }

   static void f1() {
       f2();
   }

   static void f2() {
       f3();
   }

   static void f3() {
       f4();
   }

   static void f4() {
       Thread.dumpStack();
   }

}
When the above code is executed, we get the following output:
java.lang.Exception: Stack trace
    at java.base/java.lang.Thread.dumpStack(Thread.java:1380)
    at com.example.myJavaProject.Example.f4(Example.java:25)
    at com.example.myJavaProject.Example.f3(Example.java:20)
    at com.example.myJavaProject.Example.f2(Example.java:15)
    at com.example.myJavaProject.Example.f1(Example.java:10)
    at com.example.myJavaProject.Example.main(Example.java:6)
How to Read and Analyze Example 1’s Stack Trace
Let’s consider Example 1 for this analysis. Below is the breakdown of the output from its execution:
The first line in the stack trace:
The bottom line in the stack trace:
Now, let’s look at the entire stack trace and try to analyze it:
Enter value in Celsius to convert in fahrenheit: hero
Exception in thread "main" java.util.InputMismatchException
    at java.base/java.util.Scanner.throwFor(Scanner.java:939)
    at java.base/java.util.Scanner.next(Scanner.java:1594)
    at java.base/java.util.Scanner.nextFloat(Scanner.java:2496)
    at com.example.myJavaProject.hello.main(hello.java:12)
The main() method is at the bottom of the stack because that is where the program began. By reading from bottom to top, we can now identify where and what exception is being raised. Tracing the source of this error back to the main() method reveals that an exception occurs when the user’s input is taken.
The second line from the top shows that the float input was taken using the function nextFloat(), which in turn calls the next() function, which in turn calls the throwFor() function. As a result, it throws an InputMismatchException.
How to Fix Example 1’s Code Using Error Handling and Stack Traces
Stack traces and exceptions are clearly related, as evidenced by the preceding examples. Stack traces can be avoided; in short, some common error handling techniques can be used to handle and resolve any exceptions thrown by the code during execution. The technique listed below can help avoid a stack trace.
Examine, Investigate, and Handle Java Errors
It’s common for amateur programmers to overlook exceptions in their code. Being able to examine, investigate, and handle mistakes can be very helpful prior to moving to the next step. Let’s handle the exception in Example 1 by using try and catch statements.
import java.util.Scanner;

public class hello {
   public static void main(String[] args) {
       Scanner scanner = new Scanner(System.in);

       System.out.print("Enter value in Celsius to convert in fahrenheit:");

       try {

           double Celsius = scanner.nextFloat();
           double fahrenheit = (Celsius * 1.8) + 32;

           System.out.printf("%.1f degrees Celsuis is %.1f degrees in Fahrenheit ", Celsius, fahrenheit);
       } catch (InputMismatchException e) {
           System.out.println("Wrong input type entered...exiting the program");
       }

   }
}
In the above code, we have used a try—catch block to catch the exception and then print a custom message to notify the user to enter a valid input.
When the code above is executed, we get the following output:
Enter value in Celsius to convert in fahrenheit: hero
Wrong input type entered…exiting the program
Process finished with exit code 0
With the help of the try and catch blocks, the code to be tested is placed in the try block and any exception thrown by the code is handled in the catch block.
This is the most commonly used method to handle exceptions in Java and thus avoid stack traces.
Track, Analyze and Manage Errors With Rollbar
Managing errors and exceptions in your code is challenging. It can make deploying production code an unnerving experience. Being able to track, analyse, and manage errors in real-time can help you proceed with more confidence. Rollbar automates error monitoring and triaging, making fixing Java errors easier than ever. Sign Up Today!