
| title | description | ms.date | ms.topic | f1_keywords | dev_langs | helpviewer_keywords | ms.assetid | author | ms.author | manager | ms.technology | ms.workload | |||||||||||||||||||||
|---|---|---|---|---|---|---|---|---|---|---|---|---|---|---|---|---|---|---|---|---|---|---|---|---|---|---|---|---|---|---|---|---|---|
|
Manage exceptions with the debugger | Microsoft Docs |
Learn how to specify which exceptions the debugger breaks on, at which point you want the debugger to break, and how breaks are handled. |
01/23/2023 |
how-to |
|
|
|
43a77fa8-37d0-4c98-a334-0134dbca4ece |
mikejo5000 |
mikejo |
jmartens |
vs-ide-debug |
multiple |
Manage exceptions with the debugger in Visual Studio
[!INCLUDE Visual Studio]
An exception is an indication of an error state that occurs while a program is being executed. You can tell the debugger which exceptions or sets of exceptions to break on, and at which point you want the debugger to break (that is, pause in the debugger). When the debugger breaks, it shows you where the exception was thrown. You can also add or delete exceptions. With a solution open in Visual Studio, use Debug > Windows > Exception Settings to open the Exception Settings window.
Provide handlers that respond to the most important exceptions. If you need to know how to add handlers for exceptions, see Fix bugs by writing better C# code. Also, learn how to configure the debugger to always break execution for some exceptions.
When an exception occurs, the debugger writes an exception message to the Output window. It may break execution in the following cases when:
- An exception is thrown that isn’t handled.
- The debugger is configured to break execution before any handler is invoked.
- You have set Just My Code, and the debugger is configured to break on any exception that isn’t handled in user code.
[!NOTE]
ASP.NET has a top-level exception handler that shows error pages in a browser. It doesn’t break execution unless Just My Code is turned on. For an example, see Tell the debugger to continue on user-unhandled exceptions below.
[!NOTE]
In a Visual Basic application, the debugger manages all errors as exceptions, even if you use On Error-style error handlers.
Tell the debugger to break when an exception is thrown
The debugger can break execution at the point where an exception is thrown, so you may examine the exception before a handler is invoked.
In the Exception Settings window (Debug > Windows > Exception Settings), expand the node for a category of exceptions, such as Common Language Runtime Exceptions. Then select the check box for a specific exception within that category, such as System.AccessViolationException. You can also select an entire category of exceptions.
::: moniker range=»<=vs-2019″

::: moniker-end
::: moniker range=»>=vs-2022″

::: moniker-end
[!TIP]
You can find specific exceptions by using the Search window in the Exception Settings toolbar, or use search to filter for specific namespaces (such as System.IO).
If you select an exception in the Exception Settings window, debugger execution will break wherever the exception is thrown, no matter whether it’s handled. Now the exception is called a first chance exception. For example, here are a couple of scenarios:
-
In the following C# console application, the Main method throws an AccessViolationException inside a
try/catchblock.static void Main(string[] args) { try { throw new AccessViolationException(); Console.WriteLine("here"); } catch (Exception e) { Console.WriteLine("caught exception"); } Console.WriteLine("goodbye"); }
If you have AccessViolationException checked in Exception Settings, execution will break on the
throwline when you run this code in the debugger. You can then continue execution. The console should display both lines:but it doesn’t display the
hereline. -
A C# console application references a class library with a class that has two methods. One method throws an exception and handles it, while a second method throws the same exception but doesn’t handle it.
public class Class1
{
    public void ThrowHandledException()
    {
        try
        {
            throw new AccessViolationException();
        }
        catch (AccessViolationException ave)
        {
            Console.WriteLine("caught exception" + ave.Message);
        }
    }

    public void ThrowUnhandledException()
    {
        throw new AccessViolationException();
    }
}
Here’s the Main() method of the console application:
static void Main(string[] args)
{
    Class1 class1 = new Class1();
    class1.ThrowHandledException();
    class1.ThrowUnhandledException();
}
If you have AccessViolationException checked in Exception Settings, execution will break on the
throwline in both ThrowHandledException() and ThrowUnhandledException() when you run this code in the debugger.
To restore the exception settings to the defaults, choose the Restore the list to the default settings button:
::: moniker range=»<=vs-2019″

::: moniker-end
::: moniker range=»>=vs-2022″

::: moniker-end
Tell the debugger to continue on user-unhandled exceptions
If you are debugging .NET or JavaScript code with Just My Code, you can tell the debugger to prevent breaking on exceptions that aren’t handled in user code but are handled elsewhere.
-
In the Exception Settings window, open the shortcut menu by right-clicking a column label, and then select Show Columns > Additional Actions. (If you’ve turned off Just My Code, you won’t see this command.) A third column named Additional Actions appears.
::: moniker range=»<=vs-2019″

::: moniker-end
::: moniker range=»>=vs-2022″
::: moniker-end
For an exception that shows Continue when unhandled in user code in this column, the debugger continues if that exception isn’t handled in user code but is handled externally.
-
To change this setting for a particular exception, select the exception, right-click to show the shortcut menu, and select Continue When Unhandled in User Code. You may also change the setting for an entire category of exceptions, such as the entire Common Language Runtime exceptions).
::: moniker range=»<=vs-2019″
::: moniker-end
::: moniker range=»>=vs-2022″
::: moniker-end


For example, ASP.NET web applications handle exceptions by converting them to an HTTP 500 status code (Exception handling in ASP.NET Web API), which may not help you determine the source of the exception. In the example below, the user code makes a call to String.Format() that throws a xref:System.FormatException. Execution breaks as follows:

Add and delete exceptions
You can add and delete exceptions. To delete an exception type from a category, select the exception, and choose the Delete the selected exception from the list button (the minus sign) on the Exception Settings toolbar. Or you may right-click the exception and select Delete from the shortcut menu. Deleting an exception has the same effect as having the exception unchecked, which is that the debugger won’t break when it’s thrown.
To add an exception:
-
In the Exception Settings window, select one of the exception categories (for example, Common Language Runtime).
-
Choose the Add an exception to the selected category button (the plus sign).
::: moniker range=»<=vs-2019″
::: moniker-end
::: moniker range=»>=vs-2022″
::: moniker-end
-
Type the name of the exception (for example, System.UriTemplateMatchException).
::: moniker range=»<=vs-2019″
::: moniker-end
::: moniker range=»>=vs-2022″
::: moniker-end
The exception is added to the list (in alphabetical order) and automatically checked.


To add an exception to the GPU Memory Access Exceptions, JavaScript Runtime Exceptions, or Win32 Exceptions categories, include the error code and the description.
[!TIP]
Check your spelling! The Exception Settings window doesn’t check for the existence of an added exception. So if you type Sytem.UriTemplateMatchException, you’ll get an entry for that exception (and not for System.UriTemplateMatchException).
Exception settings are persisted in the solution’s .suo file, so they apply to a particular solution. You can’t reuse specific exception settings across solutions. Now only added exceptions are persisted; deleted exceptions aren’t. You may add an exception, close and reopen the solution, and the exception will still be there. But if you delete an exception and close/reopen the solution, the exception will reappear.
The Exception Settings window supports generic exception types in C# but not in Visual Basic. To break on exceptions like MyNamespace.GenericException<T>, you must add the exception as MyNamespace.GenericException`1. That is, if you’ve created an exception like this code:
public class GenericException<T> : Exception
{
    public GenericException() : base("This is a generic exception.")
    {
    }
}
You can add the exception to Exception Settings using the previous procedure:
::: moniker range=»<=vs-2019″

::: moniker-end
::: moniker range=»>=vs-2022″

::: moniker-end
Add conditions to an exception
Use the Exception Settings window to set conditions on exceptions. Currently supported conditions include the module name(s) to include or exclude for the exception. By setting module names as conditions, you can choose to break for the exception only on certain code modules. You may also choose to avoid breaking on particular modules.
[!NOTE]
Adding conditions to an exception is supported starting in [!includevs_dev15].
To add conditional exceptions:
-
Choose the Edit conditions button in the Exception Settings window, or right-click the exception and choose Edit Conditions.
-
To add extra required conditions to the exception, select Add Condition for each new condition. Additional condition lines appear.
-
For each condition line, type the name of the module, and change the comparison operator list to Equals or Not Equals. You may specify wildcards (*) in the name to specify more than one module.
-
If you need to delete a condition, choose the X at the end of the condition line.


See also
- Continue execution after an exception
- How to: Examine system code after an exception
- How to: Use native run-time checks
- First look at the debugger
One of the key features of Visual Studio Code is its great debugging support. VS Code’s built-in debugger helps accelerate your edit, compile, and debug loop.
Debugger extensions
VS Code has built-in debugging support for the Node.js runtime and can debug JavaScript, TypeScript, or any other language that gets transpiled to JavaScript.
For debugging other languages and runtimes (including PHP, Ruby, Go, C#, Python, C++, PowerShell and many others), look for Debuggers extensions in the VS Code Marketplace or select Install Additional Debuggers in the top-level Run menu.
Below are several popular extensions which include debugging support:
Tip: The extensions shown above are dynamically queried. Select an extension tile above to read the description and reviews to decide which extension is best for you.
Start debugging
The following documentation is based on the built-in Node.js debugger, but most of the concepts and features are applicable to other debuggers as well.
It is helpful to first create a sample Node.js application before reading about debugging. You can follow the Node.js walkthrough to install Node.js and create a simple «Hello World» JavaScript application (app.js). Once you have a simple application set up, this page will take you through VS Code debugging features.
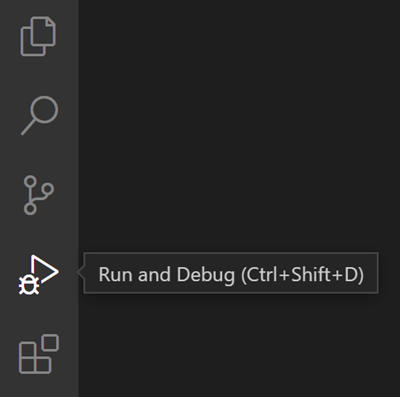
Run and Debug view
To bring up the Run and Debug view, select the Run and Debug icon in the Activity Bar on the side of VS Code. You can also use the keyboard shortcut ⇧⌘D (Windows, Linux Ctrl+Shift+D).
The Run and Debug view displays all information related to running and debugging and has a top bar with debugging commands and configuration settings.
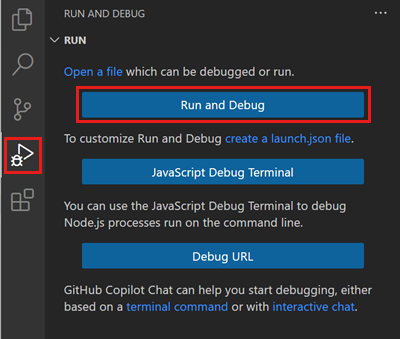
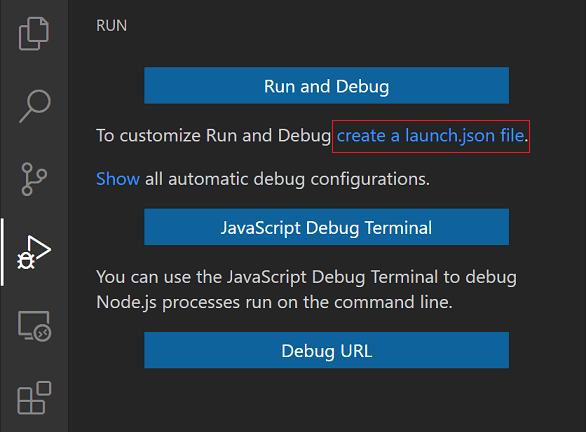
If running and debugging is not yet configured (no launch.json has been created), VS Code shows the Run start view.
The top-level Run menu has the most common run and debug commands:
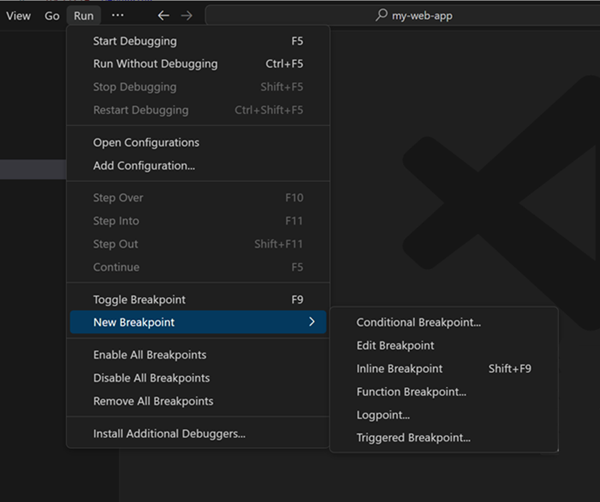
Launch configurations
To run or debug a simple app in VS Code, select Run and Debug on the Debug start view or press F5 and VS Code will try to run your currently active file.
However, for most debugging scenarios, creating a launch configuration file is beneficial because it allows you to configure and save debugging setup details. VS Code keeps debugging configuration information in a launch.json file located in a .vscode folder in your workspace (project root folder) or in your user settings or workspace settings.
To create a launch.json file, click the create a launch.json file link in the Run start view.
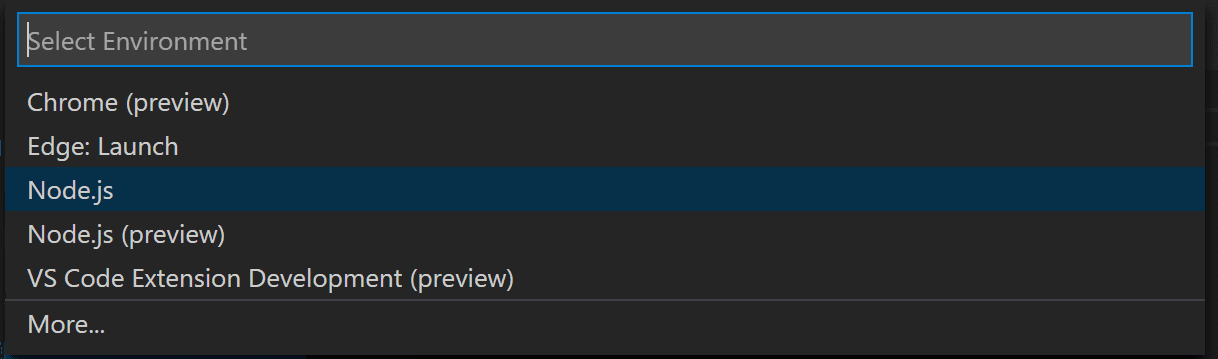
VS Code will try to automatically detect your debug environment, but if this fails, you will have to choose it manually:
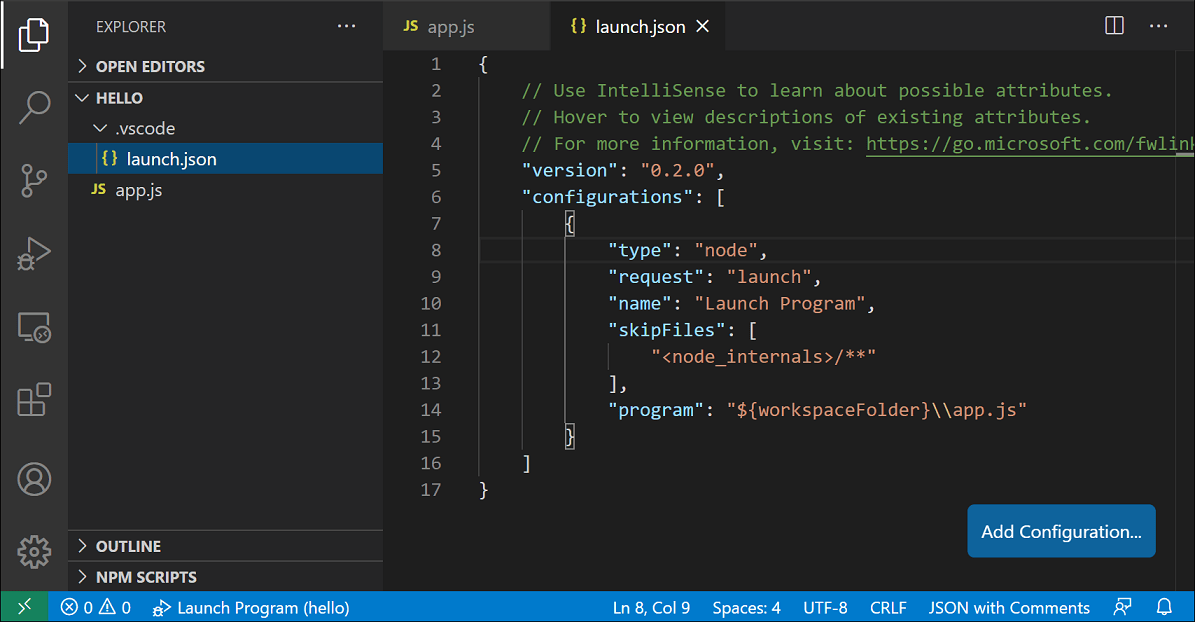
Here is the launch configuration generated for Node.js debugging:
{
  "version": "0.2.0",
  "configurations": [
    {
      "type": "node",
      "request": "launch",
      "name": "Launch Program",
      "skipFiles": ["<node_internals>/**"],
      "program": "${workspaceFolder}\app.js"
    }
  ]
}
If you go back to the File Explorer view (⇧⌘E (Windows, Linux Ctrl+Shift+E)), you’ll see that VS Code has created a .vscode folder and added the launch.json file to your workspace.
Note: You can debug a simple application even if you don’t have a folder open in VS Code, but it is not possible to manage launch configurations and set up advanced debugging. The VS Code Status Bar is purple if you do not have a folder open.
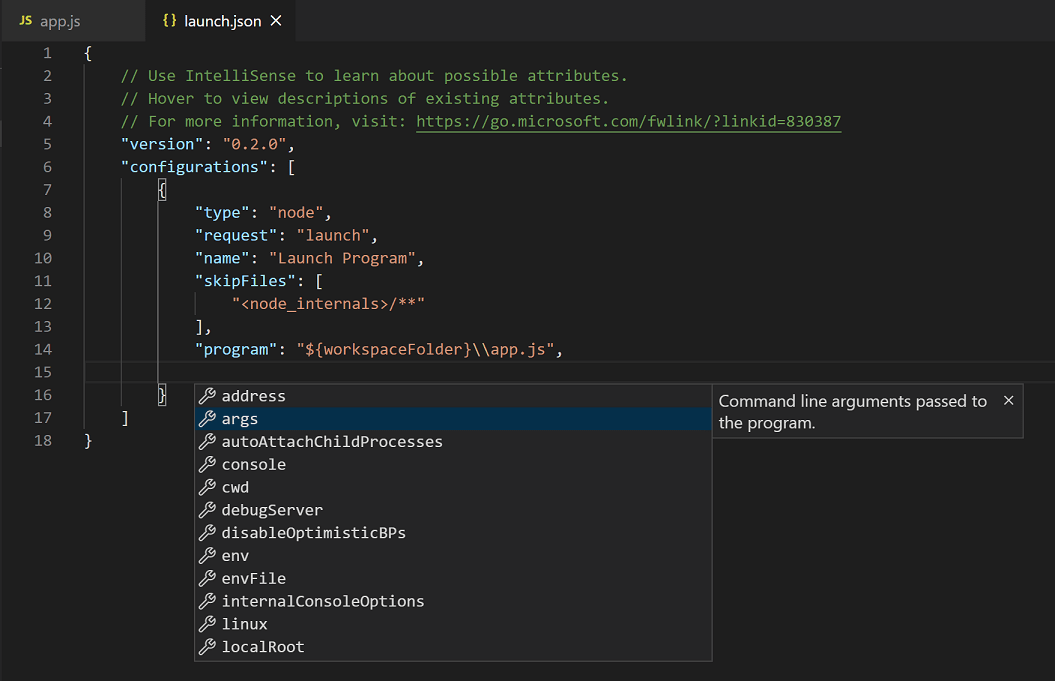
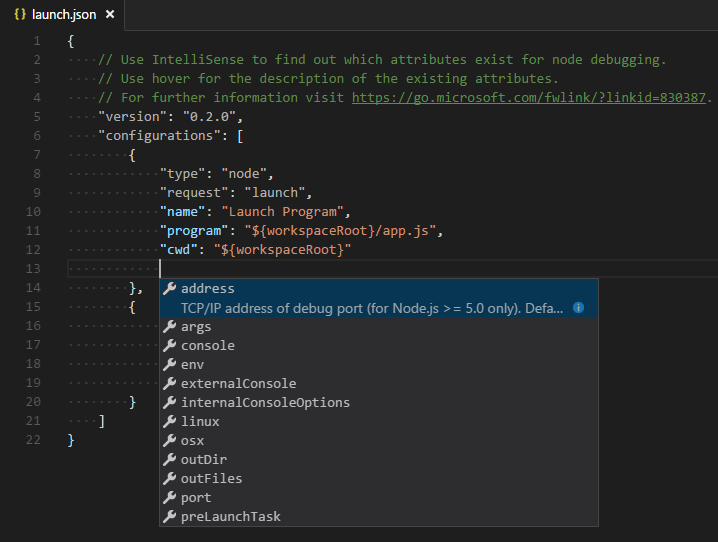
Note that the attributes available in launch configurations vary from debugger to debugger. You can use IntelliSense suggestions (⌃Space (Windows, Linux Ctrl+Space)) to find out which attributes exist for a specific debugger. Hover help is also available for all attributes.
Do not assume that an attribute that is available for one debugger automatically works for other debuggers too. If you see green squiggles in your launch configuration, hover over them to learn what the problem is and try to fix them before launching a debug session.
Review all automatically generated values and make sure that they make sense for your project and debugging environment.
Launch versus attach configurations
In VS Code, there are two core debugging modes, Launch and Attach, which handle two different workflows and segments of developers. Depending on your workflow, it can be confusing to know what type of configuration is appropriate for your project.
If you come from a browser Developer Tools background, you might not be used to «launching from your tool,» since your browser instance is already open. When you open DevTools, you are simply attaching DevTools to your open browser tab. On the other hand, if you come from a server or desktop background, it’s quite normal to have your editor launch your process for you, and your editor automatically attaches its debugger to the newly launched process.
The best way to explain the difference between launch and attach is to think of a launch configuration as a recipe for how to start your app in debug mode before VS Code attaches to it, while an attach configuration is a recipe for how to connect VS Code’s debugger to an app or process that’s already running.
VS Code debuggers typically support launching a program in debug mode or attaching to an already running program in debug mode. Depending on the request (attach or launch), different attributes are required, and VS Code’s launch.json validation and suggestions should help with that.
Add a new configuration
To add a new configuration to an existing launch.json, use one of the following techniques:
- Use IntelliSense if your cursor is located inside the configurations array.
- Press the Add Configuration button to invoke snippet IntelliSense at the start of the array.
- Choose Add Configuration option in the Run menu.
VS Code also supports compound launch configurations for starting multiple configurations at the same time; for more details, please read this section.
In order to start a debug session, first select the configuration named Launch Program using the Configuration dropdown in the Run and Debug view. Once you have your launch configuration set, start your debug session with F5.
Alternatively, you can run your configuration through the Command Palette (⇧⌘P (Windows, Linux Ctrl+Shift+P)) by filtering on Debug: Select and Start Debugging or typing 'debug ' and selecting the configuration you want to debug.
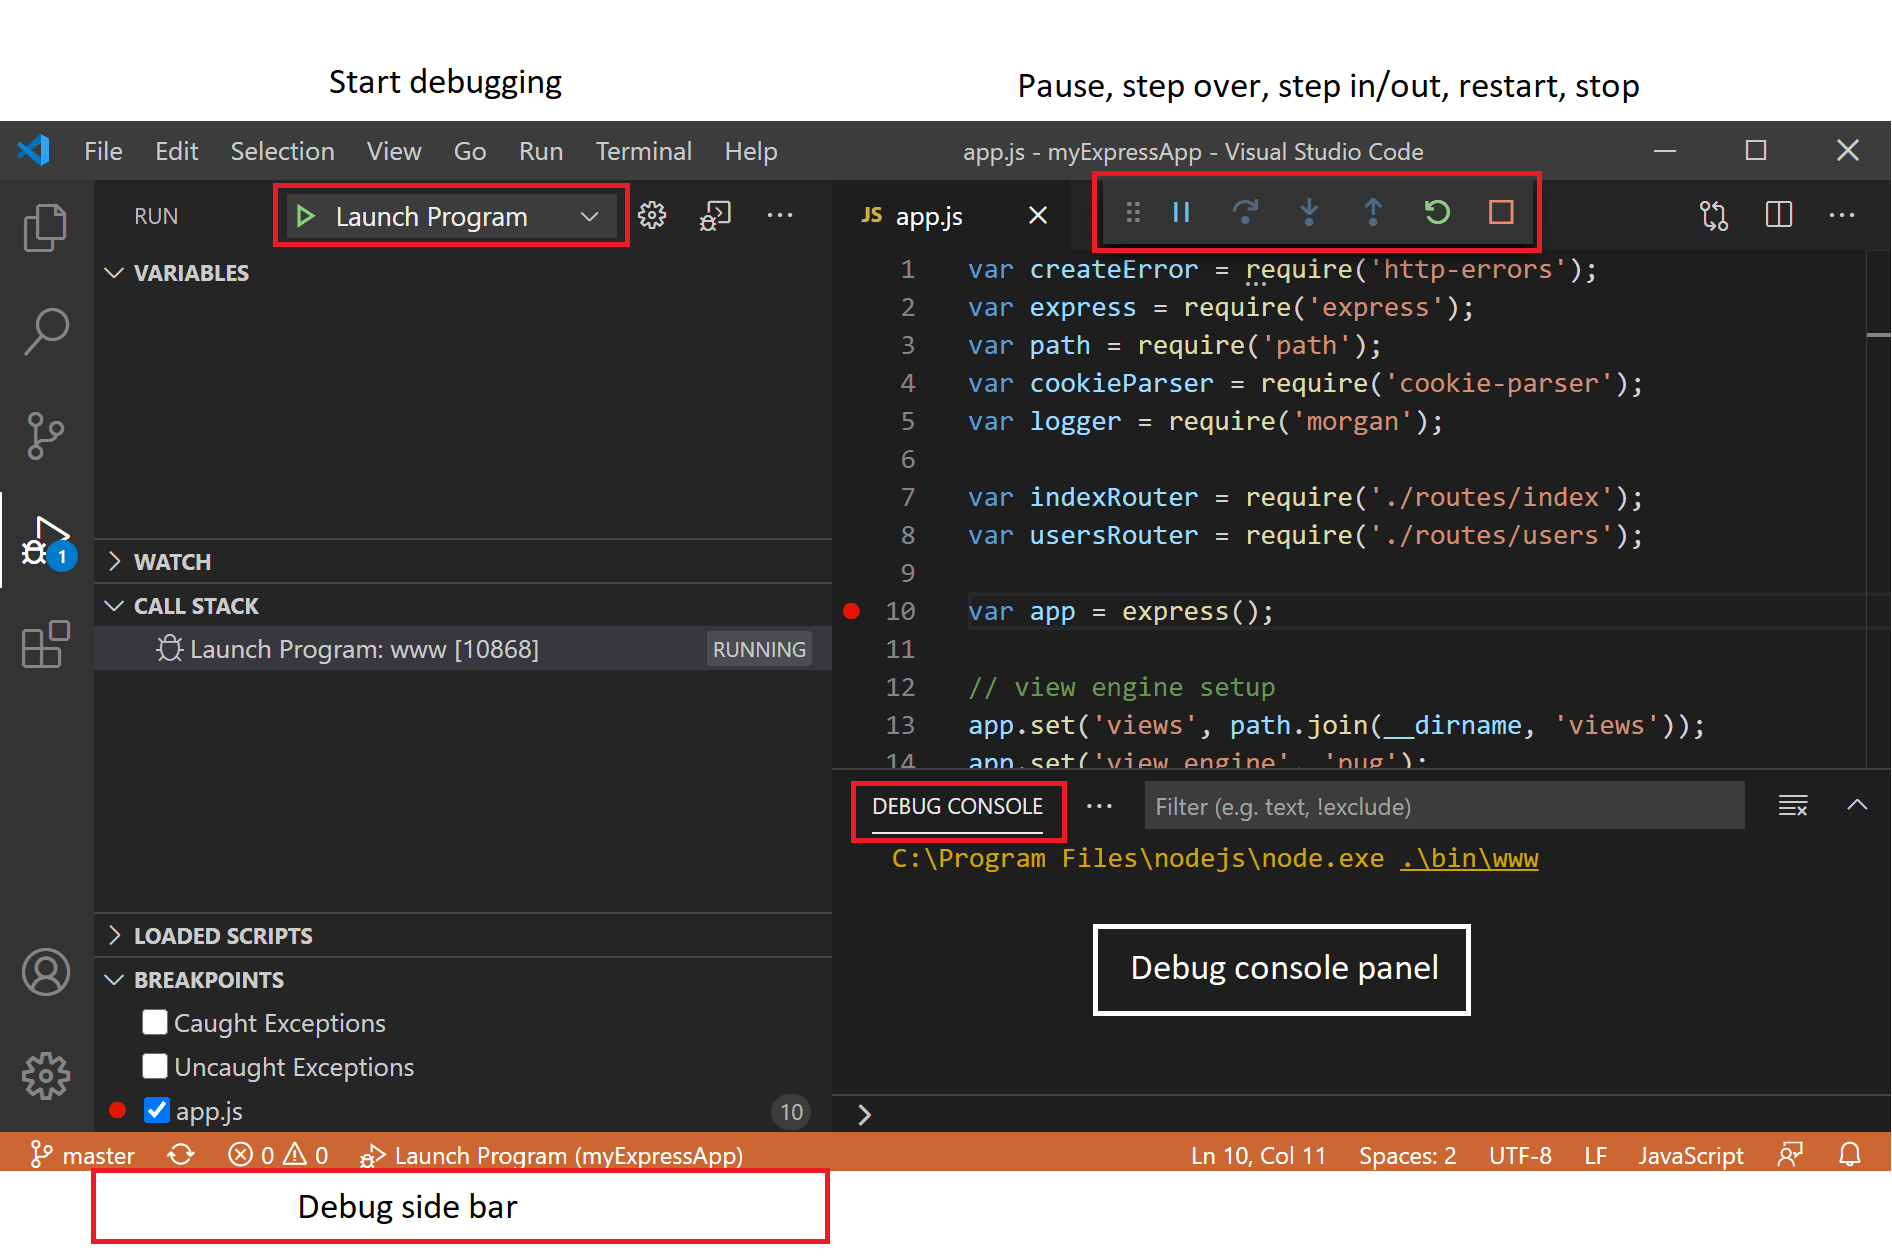
As soon as a debugging session starts, the DEBUG CONSOLE panel is displayed and shows debugging output, and the Status Bar changes color (orange for default color themes):
In addition, the debug status appears in the Status Bar showing the active debug configuration. By selecting the debug status, a user can change the active launch configuration and start debugging without needing to open the Run and Debug view.
Debug actions
Once a debug session starts, the Debug toolbar will appear on the top of the editor.

| Action | Explanation |
|---|---|
| Continue / Pause F5 |
Continue: Resume normal program/script execution (up to the next breakpoint). Pause: Inspect code executing at the current line and debug line-by-line. |
| Step Over F10 |
Execute the next method as a single command without inspecting or following its component steps. |
| Step Into F11 |
Enter the next method to follow its execution line-by-line. |
| Step Out ⇧F11 (Windows, Linux Shift+F11) |
When inside a method or subroutine, return to the earlier execution context by completing remaining lines of the current method as though it were a single command. |
| Restart ⇧⌘F5 (Windows, Linux Ctrl+Shift+F5) |
Terminate the current program execution and start debugging again using the current run configuration. |
| Stop ⇧F5 (Windows, Linux Shift+F5) |
Terminate the current program execution. |
Tip: Use the setting
debug.toolBarLocationto control the location of the debug toolbar. It can be the defaultfloating,dockedto the Run and Debug view, orhidden. Afloatingdebug toolbar can be dragged horizontally and also down to the editor area.
Run mode
In addition to debugging a program, VS Code supports running the program. The Debug: Run (Start Without Debugging) action is triggered with ⌃F5 (Windows, Linux Ctrl+F5) and uses the currently selected launch configuration. Many of the launch configuration attributes are supported in ‘Run’ mode. VS Code maintains a debug session while the program is running, and pressing the Stop button terminates the program.
Tip: The Run action is always available, but not all debugger extensions support ‘Run’. In this case, ‘Run’ will be the same as ‘Debug’.
Breakpoints
Breakpoints can be toggled by clicking on the editor margin or using F9 on the current line. Finer breakpoint control (enable/disable/reapply) can be done in the Run and Debug view’s BREAKPOINTS section.
- Breakpoints in the editor margin are normally shown as red filled circles.
- Disabled breakpoints have a filled gray circle.
- When a debugging session starts, breakpoints that cannot be registered with the debugger change to a gray hollow circle. The same might happen if the source is edited while a debug session without live-edit support is running.
If the debugger supports breaking on different kinds of errors or exceptions, those will also be available in the BREAKPOINTS view.
The Reapply All Breakpoints command sets all breakpoints again to their original location. This is helpful if your debug environment is «lazy» and «misplaces» breakpoints in source code that has not yet been executed.

Optionally, breakpoints can be shown in the editor’s overview ruler by enabling the setting debug.showBreakpointsInOverviewRuler:

Logpoints
A Logpoint is a variant of a breakpoint that does not «break» into the debugger but instead logs a message to the console. Logpoints are especially useful for injecting logging while debugging production servers that cannot be paused or stopped.
A Logpoint is represented by a «diamond» shaped icon. Log messages are plain text but can include expressions to be evaluated within curly braces (‘{}’).
Just like regular breakpoints, Logpoints can be enabled or disabled and can also be controlled by a condition and/or hit count.
Note: Logpoints are supported by VS Code’s built-in Node.js debugger, but can be implemented by other debug extensions. The Python and Java extensions, for example, support Logpoints.
Data inspection
Variables can be inspected in the VARIABLES section of the Run and Debug view or by hovering over their source in the editor. Variable values and expression evaluation are relative to the selected stack frame in the CALL STACK section.
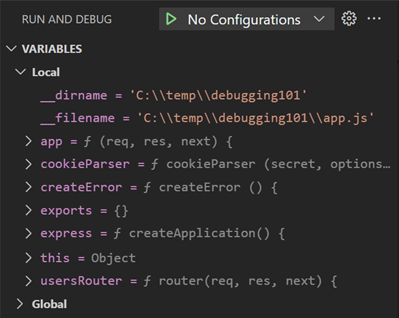
Variable values can be modified with the Set Value action from the variable’s context menu. Additionally, you can use the Copy Value action to copy the variable’s value, or Copy as Expression action to copy an expression to access the variable.
Variables and expressions can also be evaluated and watched in the Run and Debug view’s WATCH section.

Variable names and values can be filtered by typing while the focus is on the VARIABLES section.

Launch.json attributes
There are many launch.json attributes to help support different debuggers and debugging scenarios. As mentioned above, you can use IntelliSense (⌃Space (Windows, Linux Ctrl+Space)) to see the list of available attributes once you have specified a value for the type attribute.
The following attributes are mandatory for every launch configuration:
type— the type of debugger to use for this launch configuration. Every installed debug extension introduces a type:nodefor the built-in Node debugger, for example, orphpandgofor the PHP and Go extensions.request— the request type of this launch configuration. Currently,launchandattachare supported.name— the reader-friendly name to appear in the Debug launch configuration dropdown.
Here are some optional attributes available to all launch configurations:
presentation— using theorder,group, andhiddenattributes in thepresentationobject, you can sort, group, and hide configurations and compounds in the Debug configuration dropdown and in the Debug quick pick.preLaunchTask— to launch a task before the start of a debug session, set this attribute to the label of a task specified in tasks.json (in the workspace’s.vscodefolder). Or, this can be set to${defaultBuildTask}to use your default build task.postDebugTask— to launch a task at the very end of a debug session, set this attribute to the name of a task specified in tasks.json (in the workspace’s.vscodefolder).internalConsoleOptions— this attribute controls the visibility of the Debug Console panel during a debugging session.debugServer— for debug extension authors only: this attribute allows you to connect to a specified port instead of launching the debug adapter.serverReadyAction— if you want to open a URL in a web browser whenever the program under debugging outputs a specific message to the debug console or integrated terminal. For details see section Automatically open a URI when debugging a server program below.
Many debuggers support some of the following attributes:
program— executable or file to run when launching the debuggerargs— arguments passed to the program to debugenv— environment variables (the valuenullcan be used to «undefine» a variable)envFile— path to dotenv file with environment variablescwd— current working directory for finding dependencies and other filesport— port when attaching to a running processstopOnEntry— break immediately when the program launchesconsole— what kind of console to use, for example,internalConsole,integratedTerminal, orexternalTerminal
Variable substitution
VS Code makes commonly used paths and other values available as variables and supports variable substitution inside strings in launch.json. This means that you do not have to use absolute paths in debug configurations. For example, ${workspaceFolder} gives the root path of a workspace folder, ${file} the file open in the active editor, and ${env:Name} the environment variable ‘Name’. You can see a full list of predefined variables in the Variables Reference or by invoking IntelliSense inside the launch.json string attributes.
{
  "type": "node",
  "request": "launch",
  "name": "Launch Program",
  "program": "${workspaceFolder}/app.js",
  "cwd": "${workspaceFolder}",
  "args": ["${env:USERNAME}"]
}
Platform-specific properties
Launch.json supports defining values (for example, arguments to be passed to the program) that depend on the operating system where the debugger is running. To do so, put a platform-specific literal into the launch.json file and specify the corresponding properties inside that literal.
Below is an example that passes "args" to the program differently on Windows:
{
  "version": "0.2.0",
  "configurations": [
    {
      "type": "node",
      "request": "launch",
      "name": "Launch Program",
      "program": "${workspaceFolder}/node_modules/gulp/bin/gulpfile.js",
      "args": ["myFolder/path/app.js"],
      "windows": {
        "args": ["myFolder\path\app.js"]
      }
    }
  ]
}
Valid operating properties are "windows" for Windows, "linux" for Linux, and "osx" for macOS. Properties defined in an operating system specific scope override properties defined in the global scope.
Please note that the type property cannot be placed inside a platform-specific section, because type indirectly determines the platform in remote debugging scenarios, and that would result in a cyclic dependency.
In the example below, debugging the program always stops on entry except on macOS:
{
  "version": "0.2.0",
  "configurations": [
    {
      "type": "node",
      "request": "launch",
      "name": "Launch Program",
      "program": "${workspaceFolder}/node_modules/gulp/bin/gulpfile.js",
      "stopOnEntry": true,
      "osx": {
        "stopOnEntry": false
      }
    }
  ]
}
Global launch configuration
VS Code supports adding a "launch" object inside your User settings. This "launch" configuration will then be shared across your workspaces. For example:
"launch": {
    "version": "0.2.0",
    "configurations": [{
        "type": "node",
        "request": "launch",
        "name": "Launch Program",
        "program": "${file}"
    }]
}
Advanced breakpoint topics
Conditional breakpoints
A powerful VS Code debugging feature is the ability to set conditions based on expressions, hit counts, or a combination of both.
- Expression condition: The breakpoint will be hit whenever the expression evaluates to
true. - Hit count: The ‘hit count’ controls how many times a breakpoint needs to be hit before it will ‘break’ execution. Whether a ‘hit count’ is respected and the exact syntax of the expression vary among debugger extensions.
You can add a condition and/or hit count when creating a source breakpoint (with the Add Conditional Breakpoint action) or when modifying an existing one (with the Edit Condition action). In both cases, an inline text box with a dropdown menu opens where you can enter expressions:
Condition and hit count editing support is also supported for function and exception breakpoints.
You can initiate condition editing from the context menu or the new inline Edit Condition action.
An example of condition editing in the BREAKPOINTS view:

If a debugger does not support conditional breakpoints, the Add Conditional Breakpoint and Edit Condition actions will be missing.
Inline breakpoints
Inline breakpoints will only be hit when the execution reaches the column associated with the inline breakpoint. This is particularly useful when debugging minified code which contains multiple statements in a single line.
An inline breakpoint can be set using ⇧F9 (Windows, Linux Shift+F9) or through the context menu during a debug session. Inline breakpoints are shown inline in the editor.
Inline breakpoints can also have conditions. Editing multiple breakpoints on a line is possible through the context menu in the editor’s left margin.
Function breakpoints
Instead of placing breakpoints directly in source code, a debugger can support creating breakpoints by specifying a function name. This is useful in situations where source is not available but a function name is known.
A function breakpoint is created by pressing the + button in the BREAKPOINTS section header and entering the function name. Function breakpoints are shown with a red triangle in the BREAKPOINTS section.
Data breakpoints
If a debugger supports data breakpoints, they can be set from the context menu in the VARIABLES view. The Break on Value Change/Read/Access commands will add a data breakpoint that is hit when the value of the underlying variable changes/is read/is accessed. Data breakpoints are shown with a red hexagon in the BREAKPOINTS section.
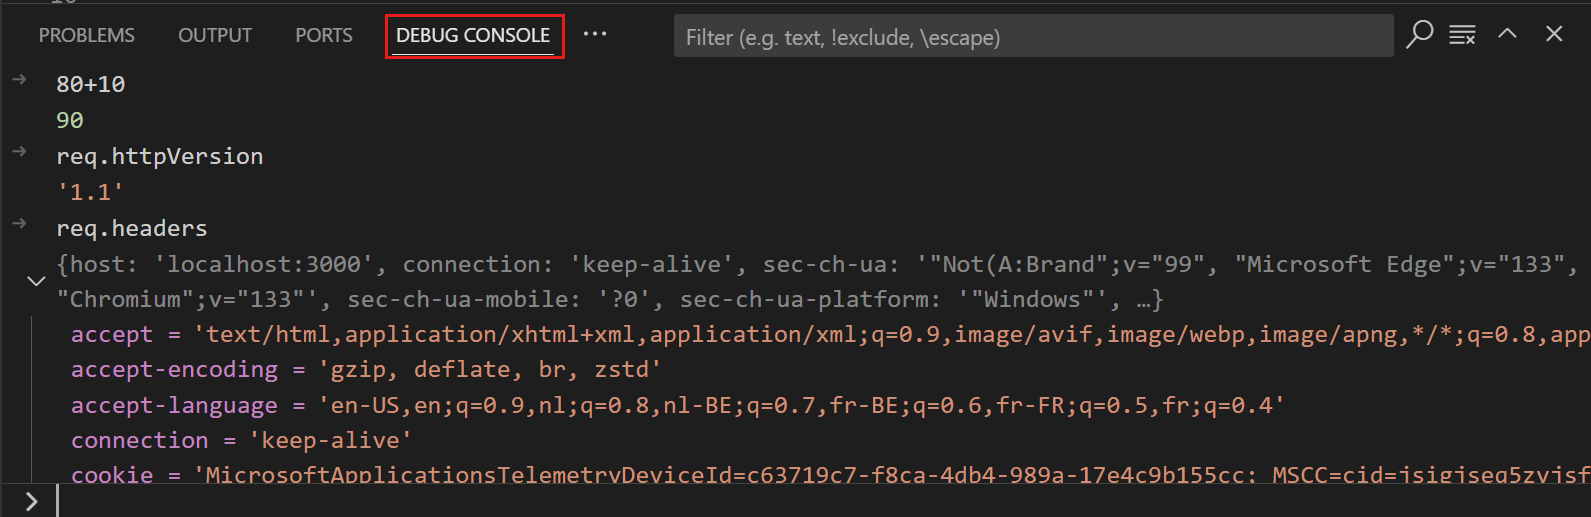
Debug Console REPL
Expressions can be evaluated with the Debug Console REPL (Read-Eval-Print Loop) feature. To open the Debug Console, use the Debug Console action at the top of the Debug pane or use the View: Debug Console command (⇧⌘Y (Windows, Linux Ctrl+Shift+Y)). Expressions are evaluated after you press Enter and the Debug Console REPL shows suggestions as you type. If you need to enter multiple lines, use Shift+Enter between the lines and then send all lines for evaluation with Enter.
Debug Console input uses the mode of the active editor, which means that the Debug Console input supports syntax coloring, indentation, auto closing of quotes, and other language features.
Note: You must be in a running debug session to use the Debug Console REPL.
Redirect input/output to/from the debug target
Redirecting input/output is debugger/runtime specific, so VS Code does not have a built-in solution that works for all debuggers.
Here are two approaches you might want to consider:
-
Launch the program to debug («debug target») manually in a terminal or command prompt and redirect input/output as needed. Make sure to pass the appropriate command line options to the debug target so that a debugger can attach to it. Create and run an «attach» debug configuration that attaches to the debug target.
-
If the debugger extension you are using can run the debug target in VS Code’s Integrated Terminal (or an external terminal), you can try to pass the shell redirect syntax (for example, «<» or «>») as arguments.
Here’s an example launch.json configuration:
{
  "name": "launch program that reads a file from stdin",
  "type": "node",
  "request": "launch",
  "program": "program.js",
  "console": "integratedTerminal",
  "args": ["<", "in.txt"]
}
This approach requires that the «<» syntax is passed through the debugger extension and ends up unmodified in the Integrated Terminal.
Multi-target debugging
For complex scenarios involving more than one process (for example, a client and a server), VS Code supports multi-target debugging.
Using multi-target debugging is simple: after you’ve started a first debug session, you can just launch another session. As soon as a second session is up and running, the VS Code UI switches to multi-target mode:
Compound launch configurations
An alternative way to start multiple debug sessions is by using a compound launch configuration. A compound launch configuration lists the names of two or more launch configurations that should be launched in parallel. Optionally a preLaunchTask can be specified that is run before the individual debug sessions are started. The boolean flag stopAll controls whether manually terminating one session will stop all of the compound sessions.
{
  "version": "0.2.0",
  "configurations": [
    {
      "type": "node",
      "request": "launch",
      "name": "Server",
      "program": "${workspaceFolder}/server.js"
    },
    {
      "type": "node",
      "request": "launch",
      "name": "Client",
      "program": "${workspaceFolder}/client.js"
    }
  ],
  "compounds": [
    {
      "name": "Server/Client",
      "configurations": ["Server", "Client"],
      "preLaunchTask": "${defaultBuildTask}",
      "stopAll": true
    }
  ]
}
Compound launch configurations are displayed in the launch configuration dropdown menu.
Remote debugging
VS Code does not itself support remote debugging: this is a feature of the debug extension you are using, and you should consult the extension’s page in the Marketplace for support and details.
There is, however, one exception: the Node.js debugger included in VS Code supports remote debugging. See the Node.js Debugging topic to learn how to configure this.
Automatically open a URI when debugging a server program
Developing a web program typically requires opening a specific URL in a web browser in order to hit the server code in the debugger. VS Code has a built-in feature «serverReadyAction» to automate this task.
Here is an example of a simple Node.js Express application:
var express = require('express');
var app = express();

app.get('/', function(req, res) {
  res.send('Hello World!');
});

app.listen(3000, function() {
  console.log('Example app listening on port 3000!');
});
This application first installs a «Hello World» handler for the «/» URL and then starts to listen for HTTP connections on port 3000. The port is announced in the Debug Console, and typically, the developer would now type http://localhost:3000 into their browser application.
The serverReadyAction feature makes it possible to add a structured property serverReadyAction to any launch config and select an «action» to be performed:
{
  "type": "node",
  "request": "launch",
  "name": "Launch Program",
  "program": "${workspaceFolder}/app.js",

  "serverReadyAction": {
    "pattern": "listening on port ([0-9]+)",
    "uriFormat": "http://localhost:%s",
    "action": "openExternally"
  }
}
Here the pattern property describes the regular expression for matching the program’s output string that announces the port. The pattern for the port number is put into parenthesis so that it is available as a regular expression capture group. In this example, we are extracting only the port number, but it is also possible to extract a full URI.
The uriFormat property describes how the port number is turned into a URI. The first %s is substituted by the first capture group of the matching pattern.
The resulting URI is then opened outside of VS Code («externally») with the standard application configured for the URI’s scheme.
Trigger Debugging via Edge or Chrome
Alternatively, the action can be set to debugWithEdge or debugWithChrome. In this mode, a webRoot property can be added that is passed to the Chrome or Edge debug session.
To simplify things a bit, most properties are optional and we use the following fallback values:
- pattern:
"listening on.* (https?://\S+|[0-9]+)"which matches the commonly used messages «listening on port 3000» or «Now listening on: https://localhost:5001». - uriFormat:
"http://localhost:%s" - webRoot:
"${workspaceFolder}"
Triggering an Arbitrary Launch Config
In some cases, you may need to configure additional options for the browser debug session—or use a different debugger entirely. You can do this by setting action to startDebugging with a name property set to the name of the launch configuration to start when the pattern is matched.
The named launch configuration must be in the same file or folder as the one with the serverReadyAction.
Here the serverReadyAction feature in action:

Next steps
To learn about VS Code’s Node.js debugging support, take a look at:
- Node.js — Describes the Node.js debugger, which is included in VS Code.
- TypeScript — The Node.js debugger also supports TypeScript debugging.
To see tutorials on the basics of Node.js debugging, check out these videos:
- Intro Video — Debugging — Showcases the basics of debugging.
- Getting started with Node.js debugging — Shows how to attach a debugger to a running Node.js process.
To learn about debugging support for other programming languages via VS Code extensions:
- C++
- Python
- Java
To learn about VS Code’s task running support, go to:
- Tasks — Describes how to run tasks with Gulp, Grunt, and Jake and how to show errors and warnings.
To write your own debugger extension, visit:
- Debugger Extension — Uses a mock sample to illustrate the steps required to create a VS Code debug extension.
Common questions
What are the supported debugging scenarios?
Debugging of Node.js-based applications is supported on Linux, macOS, and Windows out of the box with VS Code. Many other scenarios are supported by VS Code extensions available in the Marketplace.
I do not see any launch configurations in the Run and Debug view dropdown. What is wrong?
The most common problem is that you did not set up launch.json or there is a syntax error in that file. Alternatively, you might need to open a folder, since no-folder debugging does not support launch configurations.
5/3/2023
Отладка кода в Visual Studio происходит довольно просто, если сравнивать этот процесс с другими IDE. Плюс отладчик Visual Studio обладает довольно широкими возможностями и позволяет отлаживать различные технологии, а если имеющихся средств не хватает, то можно воспользоваться дополнениями.
Отладка кода — это один из самых важных процессов. Без отладки в свет не выходит ни одно нормальное приложение. Потому что, независимо от опыта разработчика, код не всегда работает так, как нужно. А иногда и вообще работает совершенно не так. Вот тут как раз и приходит на помощь отладчик, который позволит разобраться, что не так, и найти изъяны. Можно, конечно, много часов провести за самостоятельным выявлением багов, но отладчиком все-таки быстрее и проще.
В то же время отладка кода — это не волшебная палочка, которая быстренько найдет и исправит все недочеты вашего кода. Отладка — это процесс, при котором код пошагово выполняется в некой программе, например, в Visual Studio. В процессе выполнения идет поиск точек, где вы могли допустить ошибку. А вы в это время можете анализировать свой код и вносить необходимые правки для устранения «косяков».
Работа с отладчиком, даже с таким простым, как Visual Studio, требует определенных знаний и понимания, что там внутри происходит. Умение работать с отладчиком вам в любом случае пригодится, если вы хотите связать свою жизнь с разработкой ПО. В этой статье мы ознакомим вас с процессом отладки при помощи Visual Studio.
Отладка кода в Visual Studio
Перед стартом отладки вашего кода не лишним было бы для себя выяснить, существует ли какая-то проблема с вашим кодом? Для чего вам нужна отладка? Если есть какие-то проблемы в работе вашего ПО и вы хотите найти их, используя отладчик Visual Studio, нужно понять, в чем суть проблемы. Возможно, есть проблемы, которые отладчик не определит, например:
- орфографические ошибки или опечатки,
- неправильно подключенные API,
- неправильное размещение последних корректировок в код,
- и др.
В принципе, все ошибки возможно будет увидеть уже в процессе работы отладчика. При его работе активно мониторится все, что происходит с вашим ПО. А то, что вы можете в любой точке остановить отладку, дает вам возможность более детально рассмотреть состояние вашего приложения и в нужный момент перейти в построчное изучение кода.
Прежде чем запускать отладчик Visual Studio, не лишним будет проверить код редактором кода и визуально оценить. Нужно искать «красные» и «зеленые»линии. «Красные» линии — это ошибки. «Зеленые» — предупреждения. Это могут быть:
- ошибка компиляции;
- ошибка преобразования типа;
- код не поддерживает синтаксис;
- и др.
«Красные» волнистые линии нужно исправить — это поможет в дальнейшем уменьшить количество ошибок, найденных Visual Studio. А зеленые, если не получается исправить, то по крайней мере нужно тщательно изучить.
Как запустить отладчик Visual Studio
Чтобы запустить отладчик Visual Studio, нужно:
- Запустить саму программу Visual Studio.
- Открыть код приложения, который необходимо отладить.
- Потом при помощи нажатия клавиши «F5» запустить режим отладки. Также это можно сделать через меню, если нажать «Отладка», а потом «Начать отладку».
Начнется процесс отладки. При возникновении ошибок отладчик Visual Studio покажет вам строку их проявления и предоставит вам информацию о том, что произошло. Для более точного изучения кода вы можете расставить точки останова. Это те точки в коде, где отладчик Visual Studio остановит свою работу, а у вас появится возможность детальнее изучить:
последовательность исполнения кода;
работу памяти;
значение переменных и др.
Чтобы создать точку останова в отладчике, нужно кликнуть слева от интересующей вас строки кода или при помощи клавиши «F9».
Бывает такое, что сразу выявить ошибки не получается при помощи отладчика, но приложение все равно не работает корректно. Тогда вам тоже смогут помочь точки останова. Нужно выставить их перед выполнением проблемного кода, а потом запустить отладчик Visual Studio в построчном выполнении программы для детализированного анализа, и тогда баг проявится.
Какая информация выводится отладчиком Visual Studio
Итак, вы выставили несколько точек останова и запустили процесс отладки. На каждой точке останова Visual Studio будет останавливаться. В эти моменты вам будет доступна определенная информация. Чтобы ее просмотреть, нужно кликнуть кнопку «Debug» на панели инструментов и найти «Windows». Получите бонус от Пин ап казино 100% от первого депозита с вейджером отыгрыша x35 на 72 часа! Только на официальном сайте Pin Up лучшие игровые автоматы, рулетка и живые диллеры.
Там вам будет доступна следующая информация:
- Breakpoints. Тут собраны сведения о ваших точках останова.
- Output. Здесь выводятся служебные сообщения от самой Visual Studio.
- Watch. Здесь расположены переменные, за которыми вы наблюдаете в коде; внести их можно только вручную.
- Autos. Здесь находится список переменных, с которыми прямо сейчас проводится работа.
- Locals. Здесь выводятся все локальные переменные.
- Immediate. Здесь выводятся переменные, которые вы требуете.
- Call Stack. Здесь расположен список вызываемых функций.
- Threads. Тут выводится информация об уже стартовавших потоках вашего приложения.
- Modules. Отображаются все загруженные модули.
- Processes. Отображаются процессы модулей.
- Memory. Отображается память рассматриваемых модулей.
- Disassembly. Тут можно увидеть, как отображается ваш код на языке более высокого уровня.
- Registers. Выводится регистр значения.
В заключение
Отладка в Visual Studio дает возможность довольно быстро решить проблемы с вашим кодом. Да, без определенных знаний и понимания запустить и понять отладчик Visual Studio будет нелегко, но с опытом все станет понятнее. В разработке без отладки кода — путь в никуда, потому что стабильность работы приложения — это залог его качества. И если на самом старте разработки игнорировать этот процесс, то нет смысла идти дальше.
If you have just started learning C# or you are new to Visual Studio IDE and want to learn more about it, one of the best features of visual studio is debugging code, which allows developer to check the output of any variable or output of each line statement while code is executing.
What is debugging?
Debugging is simply the process to identifying a problem, and then either correcting the problem or determining a way to work around it.
In Visual studio debugging, you can see how variables value changes while the program executes, and it is possible to see these changes. This is useful for when you want to make sure the values are correct and if they aren’t correct, you can determine a way to work around of the problem.
How to debug in Visual Studio?
To start understanding Visual Studio IDE debugging, we would have to create a sample C# console application program, I am using this simple C# program in Visual Studio, which uses variables and we will test how we can see variables output while debugging.
Sample C# Program
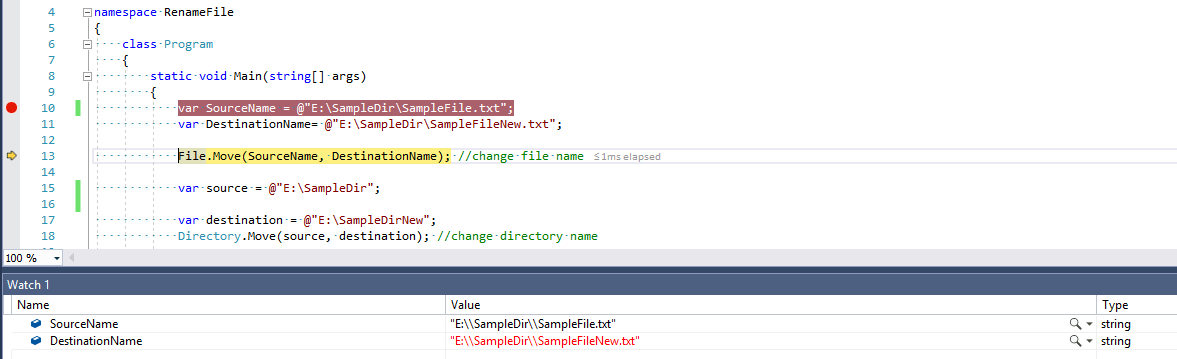
class Program
{
static void Main(string[] args)
{
// An integer
int intValue = 1;
// A string
string stringValue = "Hello";
// An array of true/false
bool[] b = new bool[]
{
true,
false,
false
};
Console.WriteLine();
}
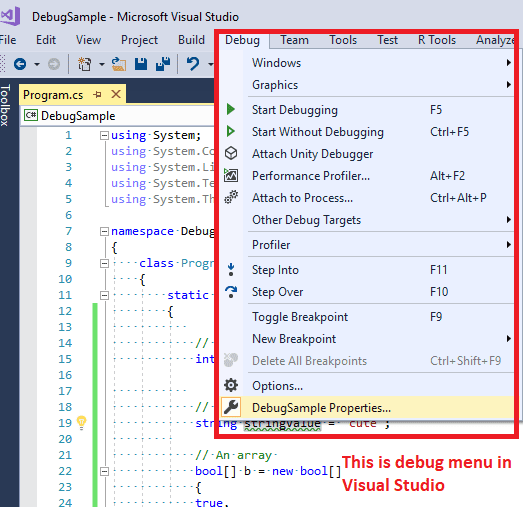
}now, as you can see above, we will be using above program in Visual Studio to debug it, and also we can see debug menu available in Visual Studio.
Add the breakpoint in Visual Studio (C# program)
Now, we should add a breakpoint in our C# program.
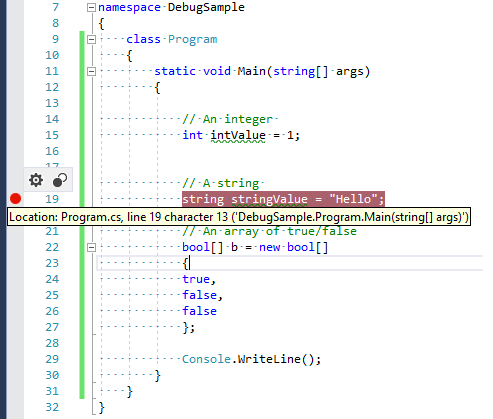
On the far left of your source code tab, you will see a narrow gray strip, Click on it in the line you want to debug. The red circle will appear once you click it, it is where you have set the debugging breakpoint.
In the above code sample and image, we are debugging line «string stringValue = "Hello";«, so when the red block is hit, it will open debugger and we can then debug code.
To Start debugging this code, press «Start» button in Visual Studio, here is the sample gif image

As you can see in the above gif image when the breakpoint is hit debugger opens and then you can hover over any variable and check it’s it value.
You can also see variables value, but navigating to «Debug -> Windows -> Locals», you should see output as below

While debugging, you can step through the code in a number of different methods, you can step through line by line using F11, step over using F10 or step out using (Shift+F11).
-
Step-Through: Each and every line of code executed will be debugged. When a method call is invoked the flow enters the method and returns to the calling line after it has completed.
-
Step Over: As above, however, you will not debug internal method calls. This is a better debug tool if you already know that a method is working and just wasn’t to call it without debugging.
- Step Out: If you entered a method using Step-Through, Step Out will return you to the point that method was called.
Disabling Debugger
Before you deploy your website on server or windows application, you should disable debugger.
- In the ASP.NET website, you can directly change the compilation tag’s debug attribute to false in web.config.
- In Windows applications, go to Project -> MyApplication Properties. Then change the Configure dropdown to Release.
Debugging tips in Visual Studio
1. Edit the value and continue
With Visual Studio 2012 or later, while debugging if you found any error in your code and want to change its value without stopping debugger or without rebuilding whole project, you can edit the value, save the changes and then continue debugging.
Edit-and-continue changes should be local, i.e., within one method. If you change the method signature, add new methods or classes, you’ll have to restart the app, or undo the changes to continue.
Note: You should have this feature enabled in your Visual Studio, to do this, you can navigate to «
Tools -> Options -> Debugging -> General > Check for ‘Enable Edit and Continue'»
2. Set next statement by dragging and dropping yellow marker
You can just drag the yellow statement marker to the line you want to be executed next, like the function that has just failed, and then simply step in.
You can drag it above break-point also, just drag and drop the yellow marker to the line you want to execute next.
You can see the example of this in point number 4, when we are dragging cursor back to first line of code in Console program.
3. Hover over mouse to variable to evaluate it’s value
Things get easier with the debugger, you can simply point your mouse at a variable of interest. Moreover, classes and structures will be expanded with one click, allowing you to find the field you need quickly and conveniently.
4. Helpful Watch window
Every modern debugger has a watch window. However, in Visual Studio you can easily add and remove variables there.
You can open up watch windows from Debug -> Windows -> Watch (Ctrl+Alt+W,1).
Just click on the empty line, type your expression, and press Enter. Or simply press the delete button to remove an expression that is no longer needed.
5. Conditional breakpoints
You can create conditional breakpoints also, for this, set a breakpoint as usual. Right click it. Click Condition.
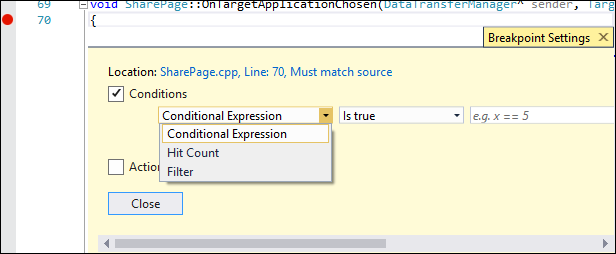
You may also like to read:
Various star pattern program in c#
How to read and write in Console app using C#?
Validating Email in ASP.NET using Regularexpressionvalidator
Understanding ASP.NET Gridview control with an example
One of the key features of Visual Studio Code is its great debugging support. VS Code’s built-in debugger helps accelerate your edit, compile, and debug loop.
Debugger extensions
VS Code has built-in debugging support for the Node.js runtime and can debug JavaScript, TypeScript, or any other language that gets transpiled to JavaScript.
For debugging other languages and runtimes (including PHP, Ruby, Go, C#, Python, C++, PowerShell and many others), look for Debuggers extensions in the VS Code Marketplace or select Install Additional Debuggers in the top-level Run menu.
Below are several popular extensions which include debugging support:
Tip: The extensions shown above are dynamically queried. Select an extension tile above to read the description and reviews to decide which extension is best for you.
Start debugging
The following documentation is based on the built-in Node.js debugger, but most of the concepts and features are applicable to other debuggers as well.
It is helpful to first create a sample Node.js application before reading about debugging. You can follow the Node.js walkthrough to install Node.js and create a simple «Hello World» JavaScript application (app.js). Once you have a simple application set up, this page will take you through VS Code debugging features.
Run and Debug view
To bring up the Run and Debug view, select the Run and Debug icon in the Activity Bar on the side of VS Code. You can also use the keyboard shortcut ⇧⌘D (Windows, Linux Ctrl+Shift+D).
The Run and Debug view displays all information related to running and debugging and has a top bar with debugging commands and configuration settings.
If running and debugging is not yet configured (no launch.json has been created), VS Code shows the Run start view.
The top-level Run menu has the most common run and debug commands:
Launch configurations
To run or debug a simple app in VS Code, select Run and Debug on the Debug start view or press F5 and VS Code will try to run your currently active file.
However, for most debugging scenarios, creating a launch configuration file is beneficial because it allows you to configure and save debugging setup details. VS Code keeps debugging configuration information in a launch.json file located in a .vscode folder in your workspace (project root folder) or in your user settings or workspace settings.
To create a launch.json file, click the create a launch.json file link in the Run start view.
VS Code will try to automatically detect your debug environment, but if this fails, you will have to choose it manually:
Here is the launch configuration generated for Node.js debugging:
{
  "version": "0.2.0",
  "configurations": [
    {
      "type": "node",
      "request": "launch",
      "name": "Launch Program",
      "skipFiles": ["<node_internals>/**"],
      "program": "${workspaceFolder}\app.js"
    }
  ]
}
If you go back to the File Explorer view (⇧⌘E (Windows, Linux Ctrl+Shift+E)), you’ll see that VS Code has created a .vscode folder and added the launch.json file to your workspace.
Note: You can debug a simple application even if you don’t have a folder open in VS Code, but it is not possible to manage launch configurations and set up advanced debugging. The VS Code Status Bar is purple if you do not have a folder open.
Note that the attributes available in launch configurations vary from debugger to debugger. You can use IntelliSense suggestions (⌃Space (Windows, Linux Ctrl+Space)) to find out which attributes exist for a specific debugger. Hover help is also available for all attributes.
Do not assume that an attribute that is available for one debugger automatically works for other debuggers too. If you see green squiggles in your launch configuration, hover over them to learn what the problem is and try to fix them before launching a debug session.
Review all automatically generated values and make sure that they make sense for your project and debugging environment.
Launch versus attach configurations
In VS Code, there are two core debugging modes, Launch and Attach, which handle two different workflows and segments of developers. Depending on your workflow, it can be confusing to know what type of configuration is appropriate for your project.
If you come from a browser Developer Tools background, you might not be used to «launching from your tool,» since your browser instance is already open. When you open DevTools, you are simply attaching DevTools to your open browser tab. On the other hand, if you come from a server or desktop background, it’s quite normal to have your editor launch your process for you, and your editor automatically attaches its debugger to the newly launched process.
The best way to explain the difference between launch and attach is to think of a launch configuration as a recipe for how to start your app in debug mode before VS Code attaches to it, while an attach configuration is a recipe for how to connect VS Code’s debugger to an app or process that’s already running.
VS Code debuggers typically support launching a program in debug mode or attaching to an already running program in debug mode. Depending on the request (attach or launch), different attributes are required, and VS Code’s launch.json validation and suggestions should help with that.
Add a new configuration
To add a new configuration to an existing launch.json, use one of the following techniques:
- Use IntelliSense if your cursor is located inside the configurations array.
- Press the Add Configuration button to invoke snippet IntelliSense at the start of the array.
- Choose Add Configuration option in the Run menu.
VS Code also supports compound launch configurations for starting multiple configurations at the same time; for more details, please read this section.
In order to start a debug session, first select the configuration named Launch Program using the Configuration dropdown in the Run and Debug view. Once you have your launch configuration set, start your debug session with F5.
Alternatively, you can run your configuration through the Command Palette (⇧⌘P (Windows, Linux Ctrl+Shift+P)) by filtering on Debug: Select and Start Debugging or typing 'debug ' and selecting the configuration you want to debug.
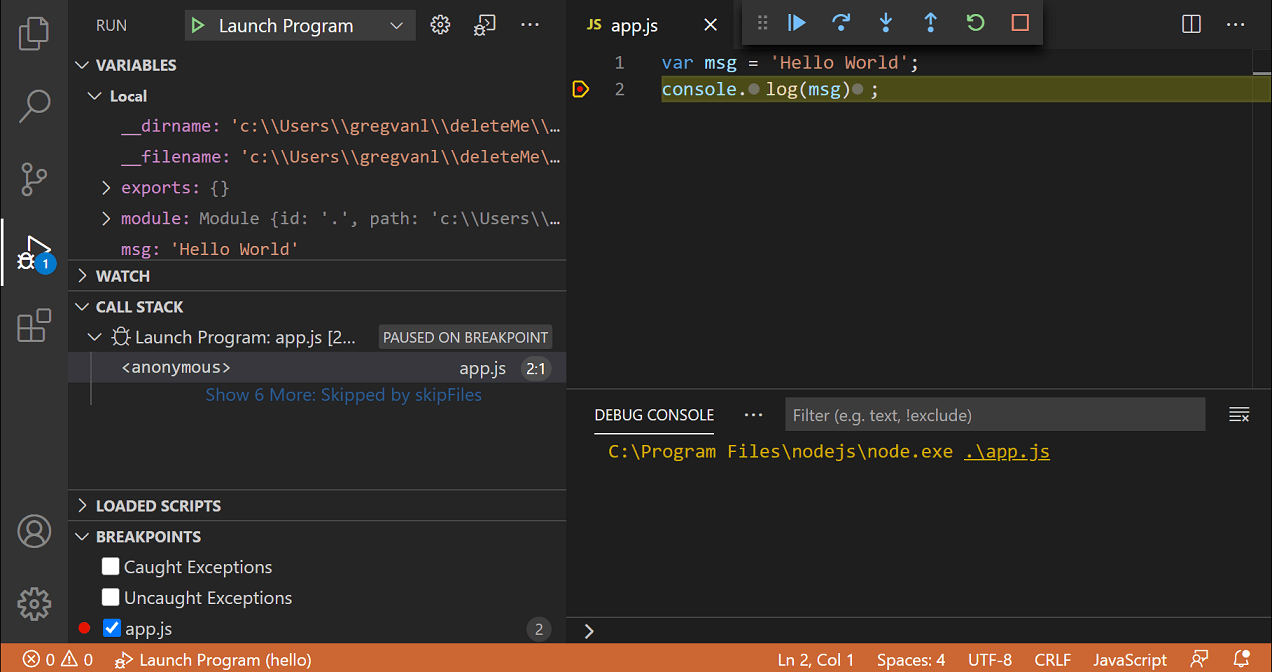
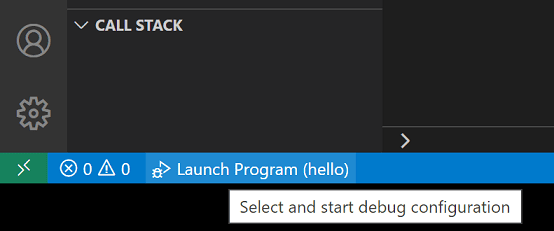
As soon as a debugging session starts, the DEBUG CONSOLE panel is displayed and shows debugging output, and the Status Bar changes color (orange for default color themes):
In addition, the debug status appears in the Status Bar showing the active debug configuration. By selecting the debug status, a user can change the active launch configuration and start debugging without needing to open the Run and Debug view.
Debug actions
Once a debug session starts, the Debug toolbar will appear on the top of the editor.
| Action | Explanation |
|---|---|
| Continue / Pause F5 |
Continue: Resume normal program/script execution (up to the next breakpoint). Pause: Inspect code executing at the current line and debug line-by-line. |
| Step Over F10 |
Execute the next method as a single command without inspecting or following its component steps. |
| Step Into F11 |
Enter the next method to follow its execution line-by-line. |
| Step Out ⇧F11 (Windows, Linux Shift+F11) |
When inside a method or subroutine, return to the earlier execution context by completing remaining lines of the current method as though it were a single command. |
| Restart ⇧⌘F5 (Windows, Linux Ctrl+Shift+F5) |
Terminate the current program execution and start debugging again using the current run configuration. |
| Stop ⇧F5 (Windows, Linux Shift+F5) |
Terminate the current program execution. |
Tip: Use the setting
debug.toolBarLocationto control the location of the debug toolbar. It can be the defaultfloating,dockedto the Run and Debug view, orhidden. Afloatingdebug toolbar can be dragged horizontally and also down to the editor area.
Run mode
In addition to debugging a program, VS Code supports running the program. The Debug: Run (Start Without Debugging) action is triggered with ⌃F5 (Windows, Linux Ctrl+F5) and uses the currently selected launch configuration. Many of the launch configuration attributes are supported in ‘Run’ mode. VS Code maintains a debug session while the program is running, and pressing the Stop button terminates the program.
Tip: The Run action is always available, but not all debugger extensions support ‘Run’. In this case, ‘Run’ will be the same as ‘Debug’.
Breakpoints
Breakpoints can be toggled by clicking on the editor margin or using F9 on the current line. Finer breakpoint control (enable/disable/reapply) can be done in the Run and Debug view’s BREAKPOINTS section.
- Breakpoints in the editor margin are normally shown as red filled circles.
- Disabled breakpoints have a filled gray circle.
- When a debugging session starts, breakpoints that cannot be registered with the debugger change to a gray hollow circle. The same might happen if the source is edited while a debug session without live-edit support is running.
If the debugger supports breaking on different kinds of errors or exceptions, those will also be available in the BREAKPOINTS view.
The Reapply All Breakpoints command sets all breakpoints again to their original location. This is helpful if your debug environment is «lazy» and «misplaces» breakpoints in source code that has not yet been executed.
Optionally, breakpoints can be shown in the editor’s overview ruler by enabling the setting debug.showBreakpointsInOverviewRuler:
Logpoints
A Logpoint is a variant of a breakpoint that does not «break» into the debugger but instead logs a message to the console. Logpoints are especially useful for injecting logging while debugging production servers that cannot be paused or stopped.
A Logpoint is represented by a «diamond» shaped icon. Log messages are plain text but can include expressions to be evaluated within curly braces (‘{}’).
Just like regular breakpoints, Logpoints can be enabled or disabled and can also be controlled by a condition and/or hit count.
Note: Logpoints are supported by VS Code’s built-in Node.js debugger, but can be implemented by other debug extensions. The Python and Java extensions, for example, support Logpoints.
Data inspection
Variables can be inspected in the VARIABLES section of the Run and Debug view or by hovering over their source in the editor. Variable values and expression evaluation are relative to the selected stack frame in the CALL STACK section.
Variable values can be modified with the Set Value action from the variable’s context menu. Additionally, you can use the Copy Value action to copy the variable’s value, or Copy as Expression action to copy an expression to access the variable.
Variables and expressions can also be evaluated and watched in the Run and Debug view’s WATCH section.
Variable names and values can be filtered by typing while the focus is on the VARIABLES section.
Launch.json attributes
There are many launch.json attributes to help support different debuggers and debugging scenarios. As mentioned above, you can use IntelliSense (⌃Space (Windows, Linux Ctrl+Space)) to see the list of available attributes once you have specified a value for the type attribute.
The following attributes are mandatory for every launch configuration:
type— the type of debugger to use for this launch configuration. Every installed debug extension introduces a type:nodefor the built-in Node debugger, for example, orphpandgofor the PHP and Go extensions.request— the request type of this launch configuration. Currently,launchandattachare supported.name— the reader-friendly name to appear in the Debug launch configuration dropdown.
Here are some optional attributes available to all launch configurations:
presentation— using theorder,group, andhiddenattributes in thepresentationobject, you can sort, group, and hide configurations and compounds in the Debug configuration dropdown and in the Debug quick pick.preLaunchTask— to launch a task before the start of a debug session, set this attribute to the label of a task specified in tasks.json (in the workspace’s.vscodefolder). Or, this can be set to${defaultBuildTask}to use your default build task.postDebugTask— to launch a task at the very end of a debug session, set this attribute to the name of a task specified in tasks.json (in the workspace’s.vscodefolder).internalConsoleOptions— this attribute controls the visibility of the Debug Console panel during a debugging session.debugServer— for debug extension authors only: this attribute allows you to connect to a specified port instead of launching the debug adapter.serverReadyAction— if you want to open a URL in a web browser whenever the program under debugging outputs a specific message to the debug console or integrated terminal. For details see section Automatically open a URI when debugging a server program below.
Many debuggers support some of the following attributes:
program— executable or file to run when launching the debuggerargs— arguments passed to the program to debugenv— environment variables (the valuenullcan be used to «undefine» a variable)envFile— path to dotenv file with environment variablescwd— current working directory for finding dependencies and other filesport— port when attaching to a running processstopOnEntry— break immediately when the program launchesconsole— what kind of console to use, for example,internalConsole,integratedTerminal, orexternalTerminal
Variable substitution
VS Code makes commonly used paths and other values available as variables and supports variable substitution inside strings in launch.json. This means that you do not have to use absolute paths in debug configurations. For example, ${workspaceFolder} gives the root path of a workspace folder, ${file} the file open in the active editor, and ${env:Name} the environment variable ‘Name’. You can see a full list of predefined variables in the Variables Reference or by invoking IntelliSense inside the launch.json string attributes.
{
  "type": "node",
  "request": "launch",
  "name": "Launch Program",
  "program": "${workspaceFolder}/app.js",
  "cwd": "${workspaceFolder}",
  "args": ["${env:USERNAME}"]
}
Platform-specific properties
Launch.json supports defining values (for example, arguments to be passed to the program) that depend on the operating system where the debugger is running. To do so, put a platform-specific literal into the launch.json file and specify the corresponding properties inside that literal.
Below is an example that passes "args" to the program differently on Windows:
{
  "version": "0.2.0",
  "configurations": [
    {
      "type": "node",
      "request": "launch",
      "name": "Launch Program",
      "program": "${workspaceFolder}/node_modules/gulp/bin/gulpfile.js",
      "args": ["myFolder/path/app.js"],
      "windows": {
        "args": ["myFolder\path\app.js"]
      }
    }
  ]
}
Valid operating properties are "windows" for Windows, "linux" for Linux, and "osx" for macOS. Properties defined in an operating system specific scope override properties defined in the global scope.
Please note that the type property cannot be placed inside a platform-specific section, because type indirectly determines the platform in remote debugging scenarios, and that would result in a cyclic dependency.
In the example below, debugging the program always stops on entry except on macOS:
{
  "version": "0.2.0",
  "configurations": [
    {
      "type": "node",
      "request": "launch",
      "name": "Launch Program",
      "program": "${workspaceFolder}/node_modules/gulp/bin/gulpfile.js",
      "stopOnEntry": true,
      "osx": {
        "stopOnEntry": false
      }
    }
  ]
}
Global launch configuration
VS Code supports adding a "launch" object inside your User settings. This "launch" configuration will then be shared across your workspaces. For example:
"launch": {
    "version": "0.2.0",
    "configurations": [{
        "type": "node",
        "request": "launch",
        "name": "Launch Program",
        "program": "${file}"
    }]
}
Advanced breakpoint topics
Conditional breakpoints
A powerful VS Code debugging feature is the ability to set conditions based on expressions, hit counts, or a combination of both.
- Expression condition: The breakpoint will be hit whenever the expression evaluates to
true. - Hit count: The ‘hit count’ controls how many times a breakpoint needs to be hit before it will ‘break’ execution. Whether a ‘hit count’ is respected and the exact syntax of the expression vary among debugger extensions.
You can add a condition and/or hit count when creating a source breakpoint (with the Add Conditional Breakpoint action) or when modifying an existing one (with the Edit Condition action). In both cases, an inline text box with a dropdown menu opens where you can enter expressions:
Condition and hit count editing support is also supported for function and exception breakpoints.
You can initiate condition editing from the context menu or the new inline Edit Condition action.
An example of condition editing in the BREAKPOINTS view:
If a debugger does not support conditional breakpoints, the Add Conditional Breakpoint and Edit Condition actions will be missing.
Inline breakpoints
Inline breakpoints will only be hit when the execution reaches the column associated with the inline breakpoint. This is particularly useful when debugging minified code which contains multiple statements in a single line.
An inline breakpoint can be set using ⇧F9 (Windows, Linux Shift+F9) or through the context menu during a debug session. Inline breakpoints are shown inline in the editor.
Inline breakpoints can also have conditions. Editing multiple breakpoints on a line is possible through the context menu in the editor’s left margin.
Function breakpoints
Instead of placing breakpoints directly in source code, a debugger can support creating breakpoints by specifying a function name. This is useful in situations where source is not available but a function name is known.
A function breakpoint is created by pressing the + button in the BREAKPOINTS section header and entering the function name. Function breakpoints are shown with a red triangle in the BREAKPOINTS section.
Data breakpoints
If a debugger supports data breakpoints, they can be set from the context menu in the VARIABLES view. The Break on Value Change/Read/Access commands will add a data breakpoint that is hit when the value of the underlying variable changes/is read/is accessed. Data breakpoints are shown with a red hexagon in the BREAKPOINTS section.
Debug Console REPL
Expressions can be evaluated with the Debug Console REPL (Read-Eval-Print Loop) feature. To open the Debug Console, use the Debug Console action at the top of the Debug pane or use the View: Debug Console command (⇧⌘Y (Windows, Linux Ctrl+Shift+Y)). Expressions are evaluated after you press Enter and the Debug Console REPL shows suggestions as you type. If you need to enter multiple lines, use Shift+Enter between the lines and then send all lines for evaluation with Enter.
Debug Console input uses the mode of the active editor, which means that the Debug Console input supports syntax coloring, indentation, auto closing of quotes, and other language features.
Note: You must be in a running debug session to use the Debug Console REPL.
Redirect input/output to/from the debug target
Redirecting input/output is debugger/runtime specific, so VS Code does not have a built-in solution that works for all debuggers.
Here are two approaches you might want to consider:
-
Launch the program to debug («debug target») manually in a terminal or command prompt and redirect input/output as needed. Make sure to pass the appropriate command line options to the debug target so that a debugger can attach to it. Create and run an «attach» debug configuration that attaches to the debug target.
-
If the debugger extension you are using can run the debug target in VS Code’s Integrated Terminal (or an external terminal), you can try to pass the shell redirect syntax (for example, «<» or «>») as arguments.
Here’s an example launch.json configuration:
{
  "name": "launch program that reads a file from stdin",
  "type": "node",
  "request": "launch",
  "program": "program.js",
  "console": "integratedTerminal",
  "args": ["<", "in.txt"]
}
This approach requires that the «<» syntax is passed through the debugger extension and ends up unmodified in the Integrated Terminal.
Multi-target debugging
For complex scenarios involving more than one process (for example, a client and a server), VS Code supports multi-target debugging.
Using multi-target debugging is simple: after you’ve started a first debug session, you can just launch another session. As soon as a second session is up and running, the VS Code UI switches to multi-target mode:
Compound launch configurations
An alternative way to start multiple debug sessions is by using a compound launch configuration. A compound launch configuration lists the names of two or more launch configurations that should be launched in parallel. Optionally a preLaunchTask can be specified that is run before the individual debug sessions are started. The boolean flag stopAll controls whether manually terminating one session will stop all of the compound sessions.
{
  "version": "0.2.0",
  "configurations": [
    {
      "type": "node",
      "request": "launch",
      "name": "Server",
      "program": "${workspaceFolder}/server.js"
    },
    {
      "type": "node",
      "request": "launch",
      "name": "Client",
      "program": "${workspaceFolder}/client.js"
    }
  ],
  "compounds": [
    {
      "name": "Server/Client",
      "configurations": ["Server", "Client"],
      "preLaunchTask": "${defaultBuildTask}",
      "stopAll": true
    }
  ]
}
Compound launch configurations are displayed in the launch configuration dropdown menu.
Remote debugging
VS Code does not itself support remote debugging: this is a feature of the debug extension you are using, and you should consult the extension’s page in the Marketplace for support and details.
There is, however, one exception: the Node.js debugger included in VS Code supports remote debugging. See the Node.js Debugging topic to learn how to configure this.
Automatically open a URI when debugging a server program
Developing a web program typically requires opening a specific URL in a web browser in order to hit the server code in the debugger. VS Code has a built-in feature «serverReadyAction» to automate this task.
Here is an example of a simple Node.js Express application:
var express = require('express');
var app = express();

app.get('/', function(req, res) {
  res.send('Hello World!');
});

app.listen(3000, function() {
  console.log('Example app listening on port 3000!');
});
This application first installs a «Hello World» handler for the «/» URL and then starts to listen for HTTP connections on port 3000. The port is announced in the Debug Console, and typically, the developer would now type http://localhost:3000 into their browser application.
The serverReadyAction feature makes it possible to add a structured property serverReadyAction to any launch config and select an «action» to be performed:
{
  "type": "node",
  "request": "launch",
  "name": "Launch Program",
  "program": "${workspaceFolder}/app.js",

  "serverReadyAction": {
    "pattern": "listening on port ([0-9]+)",
    "uriFormat": "http://localhost:%s",
    "action": "openExternally"
  }
}
Here the pattern property describes the regular expression for matching the program’s output string that announces the port. The pattern for the port number is put into parenthesis so that it is available as a regular expression capture group. In this example, we are extracting only the port number, but it is also possible to extract a full URI.
The uriFormat property describes how the port number is turned into a URI. The first %s is substituted by the first capture group of the matching pattern.
The resulting URI is then opened outside of VS Code («externally») with the standard application configured for the URI’s scheme.
Trigger Debugging via Edge or Chrome
Alternatively, the action can be set to debugWithEdge or debugWithChrome. In this mode, a webRoot property can be added that is passed to the Chrome or Edge debug session.
To simplify things a bit, most properties are optional and we use the following fallback values:
- pattern:
"listening on.* (https?://\S+|[0-9]+)"which matches the commonly used messages «listening on port 3000» or «Now listening on: https://localhost:5001». - uriFormat:
"http://localhost:%s" - webRoot:
"${workspaceFolder}"
Triggering an Arbitrary Launch Config
In some cases, you may need to configure additional options for the browser debug session—or use a different debugger entirely. You can do this by setting action to startDebugging with a name property set to the name of the launch configuration to start when the pattern is matched.
The named launch configuration must be in the same file or folder as the one with the serverReadyAction.
Here the serverReadyAction feature in action:
Next steps
To learn about VS Code’s Node.js debugging support, take a look at:
- Node.js — Describes the Node.js debugger, which is included in VS Code.
- TypeScript — The Node.js debugger also supports TypeScript debugging.
To see tutorials on the basics of Node.js debugging, check out these videos:
- Intro Video — Debugging — Showcases the basics of debugging.
- Getting started with Node.js debugging — Shows how to attach a debugger to a running Node.js process.
To learn about debugging support for other programming languages via VS Code extensions:
- C++
- Python
- Java
To learn about VS Code’s task running support, go to:
- Tasks — Describes how to run tasks with Gulp, Grunt, and Jake and how to show errors and warnings.
To write your own debugger extension, visit:
- Debugger Extension — Uses a mock sample to illustrate the steps required to create a VS Code debug extension.
Common questions
What are the supported debugging scenarios?
Debugging of Node.js-based applications is supported on Linux, macOS, and Windows out of the box with VS Code. Many other scenarios are supported by VS Code extensions available in the Marketplace.
I do not see any launch configurations in the Run and Debug view dropdown. What is wrong?
The most common problem is that you did not set up launch.json or there is a syntax error in that file. Alternatively, you might need to open a folder, since no-folder debugging does not support launch configurations.
5/3/2023
Стюарт Эшворт

В этой статье речь пойдет об отладке кода JavaScript Visual Studio. Традиционно Visual Studio известна как мощная IDE для C#.NET и VB.NET, но без особой поддержки JavaScript. Однако в последних итерациях это изменилось, и теперь вы можете использовать Visual Studio для отладки JavaScript в той же среде, что и код C#. Это делает его чрезвычайно полезным интегрированным инструментом, который ускорит процесс поиска и исправления ошибок!
Шаги, которые мы собираемся выполнить, следующие:
- Введение в пример проекта
- Анализ отчета об ошибках Raygun
- Изучите анатомию инструментов отладки Visual Studio
- Добавьте точки останова в свой код
- Шаг через свой код
- Определите состояние вашего приложения
- Исправьте ошибку!
Итак, давайте погрузимся!
Шаг 1: Введение в пример проекта
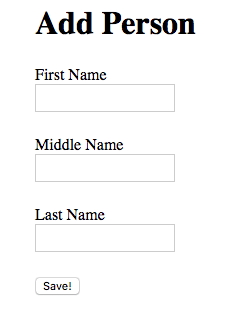
Чтобы продемонстрировать, как отлаживать приложение с помощью Visual Studio, я буду использовать простую форму добавления пользователя. Эта форма позволяет ввести имя, отчество и фамилию. При нажатии кнопки «Сохранить» форма немного обработается, и данные будут отправлены на ваш (воображаемый) сервер.
Код для этой формы имеет три функции:
- Обработчик кликов
- Строковая функция с заглавной буквы
- Функция сохранения

К сожалению, после отправки этого в производство поздно вечером в пятницу вы начинаете видеть отчеты об ошибках, поступающие на вашу панель инструментов. Есть ошибка, и вам нужно ее исправить. Быстрый.
Шаг 2. Проанализируйте отчет об ошибках Raygun
Отчеты об ошибках, которые приходят в Raygun, содержат много информации, которую вы можете использовать, чтобы найти и исправить ошибку, поэтому давайте посмотрим, с чем мы имеем дело.

Информация, которая вам понадобится для отладки ошибки, находится в модуле Stacktrace.
Часть сообщения в Stacktrace представляет собой краткий обзор того, что не так. В этом случае метод toUpperCase вызывается для неопределенного значения.
Stacktrace сообщает вам, где произошла ошибка, и последовательность вызовов функций, которая привела к ней. Как вы можете видеть на скриншоте выше, ошибка произошла в функции capitalizeString в строке 20 файла index.js.
Зная, какая строка вызвала ошибку, вы можете сразу перейти к тому месту, где произошла ошибка, и начать копаться в том, что вызвало проблему.
Первый шаг — открыть проект Visual Studio и запустить приложение, нажав кнопку. Теперь, когда приложение запущено, мы можем открыть все окна отладки, которые я буду использовать. Откройте меню «Отладка», а затем подменю Windows.

Щелкните по очереди элементы JavaScript Console, Call Stack, Watch 1, Locals, Output и Breakpoints, чтобы все они были открыты в нижней части окна Visual Studio.
Активируйте окно консоли JavaScript, щелкнув его вкладку. Эта вкладка позволяет в любое время выполнить произвольный код JavaScript или просмотреть любые выходные данные вызовов console.log.
Попробуйте ввести alert('Hello!'); и нажать Enter — предупреждение должно появиться сразу.

Вкладка «Консоль JavaScript» — ценный инструмент отладки, поскольку вы можете использовать ее как блокнот для опробования кода и оценки переменных при диагностике проблемы.
Поскольку мы находимся в знакомой среде для отладки кода на стороне сервера, вы можете найти и перемещаться по коду на стороне клиента точно так же, используя обозреватель решений. Двойной щелчок по файлу откроет его на центральной панели.

В приложении вы знаете, что проблема заключается в файле index.js, поэтому выберите его в списке обозревателя решений, чтобы просмотреть его содержимое.
Шаг 4: Добавьте точки останова в свой код
Теперь вы можете просматривать свой код, мы хотим иметь возможность просматривать его построчно, чтобы увидеть, где что-то идет не так. Для этого мы используем точки останова. Точки останова — это маркеры в определенных точках кода, которые останавливают выполнение, чтобы вы могли проверить состояние кода в этот момент времени и продолжить выполнение построчно.
Есть несколько различных способов добавления точек останова, которые я рассмотрю здесь:
Точки останова строки
Вероятно, самый распространенный способ добавить точку останова — найти конкретную строку, на которой вы хотите остановиться, и добавить ее туда. Перейдите к интересующему вас файлу и строке и щелкните серую область рядом с номером строки. К этой строке будет добавлен красный маркер, и выполнение будет останавливаться каждый раз, когда будет встречаться эта строка кода. На скриншоте ниже он остановится на строке 7 из index.js.

Программная точка останова
Вы также можете добавить точки останова программно. Этот подход полезен для условного введения точек останова, например, на определенных итерациях циклов.
Для этого вы добавляете оператор debugger; в позицию, в которой хотите прервать выполнение. Приведенный ниже код будет иметь тот же эффект, что и вышеприведенная точка разрыва строки.

Точка останова при ошибке
По умолчанию Visual Studio выводит всплывающее предупреждение, если на вашей странице возникло необработанное исключение. В этом диалоговом окне вы можете выбрать прерывание в этот момент, чтобы вы могли исследовать причину.

Шаг 5. Пройдитесь по своему коду
Теперь, когда мы знаем, как взломать наш код, мы хотим пройтись по каждой строке, чтобы понять, что происходит не так. Во-первых, поставьте точку останова в строке 7 — прямо внутри обработчика щелчка кнопки «Добавить», чтобы мы могли начать с самого начала.
В предыдущем разделе мы сделали вывод из отчета об ошибках Raygun, что ошибка возникла из-за метода capitalizeString. Этот метод вызывается три раза, так какой экземпляр является виновником? Вы можете присмотреться к трассировке стека и увидеть, что именно вызов из строки 13 вызвал ошибку. Вы знаете, что строка 13 относится к значению отчества. Таким образом, вы должны сосредоточить свои усилия на воспроизведении ошибки путем правильной обработки ввода.
Обладая этими дополнительными знаниями, вы можете заполнить поля «Имя» и «Фамилия», но оставить поле «Отчество» пустым, чтобы увидеть, не вызовет ли это ошибку.

Нажмите кнопку Сохранить. Отсюда откроется вкладка «Источник», где вы можете увидеть активированную точку останова. Теперь вы можете начать пошаговое выполнение кода. Для этого вы используете четыре кнопки на панели отладки.

Возобновляет выполнение вашего кода и продолжается до следующей точки останова. Шаги по текущей строке, перемещая нас к следующей строке. Шаги к следующему вызову функции, который находится в этой строке. Выход из текущего вызова функции, резервное копирование стека вызовов на один уровень.
Вы будете использовать их, чтобы пройти весь путь до вашей функции capitalizeString. Итак, начиная со строки 7, используйте кнопку «Перейти», пока не дойдете до строки 13. Активная строка показана желтым фоном и стрелкой, указывающей на нее.

Теперь вы можете использовать кнопку «Шаг в», чтобы перейти к вызову функции capitalizeString.

Когда вы перемещаетесь по такому коду, вы можете вернуться к родительской функции, чтобы проверить, что происходило в этот момент. Для этого используйте окно стека вызовов, которое вы открыли ранее, в котором перечислены все функции, которые были пройдены, чтобы добраться до этой точки в вашем коде — точно так же, как стек вызовов, показанный в отчете об ошибках Raygun.

Вы можете просто дважды щелкнуть элемент в этом списке, и вы вернетесь к этой функции. Имейте в виду, что текущая позиция в выполнении не меняется, поэтому использование кнопок Step Over продолжится с вершины стека вызовов.
Шаг 6: Определите состояние вашего приложения
Теперь, когда вы перешли к тому месту, где произошла ошибка, нам нужно изучить состояние приложения и выяснить, что вызывает ошибку.
Существует множество вариантов для выяснения того, какие значения содержат переменные, и оценки выражений до того, как код продолжит работу. Мы рассмотрим каждый по очереди:
Наведение мыши
Самый простой способ определить значение переменной — просто навести на нее указатель мыши, и появится всплывающая подсказка со значением. Вы даже можете выбрать группу выражений и навести на нее курсор, чтобы получить вывод выражения.
Наблюдатели
Вы можете добавлять выражения на панель Watch, которая отображает текущее значение выражения при перемещении по коду. Это удобно для отслеживания того, как со временем меняются более сложные выражения.
Вы добавляете их, либо дважды щелкнув пустую строку панели Watch и введя выражение, либо выбрав выражение, щелкнув правой кнопкой мыши и выбрав «Добавить Watch».
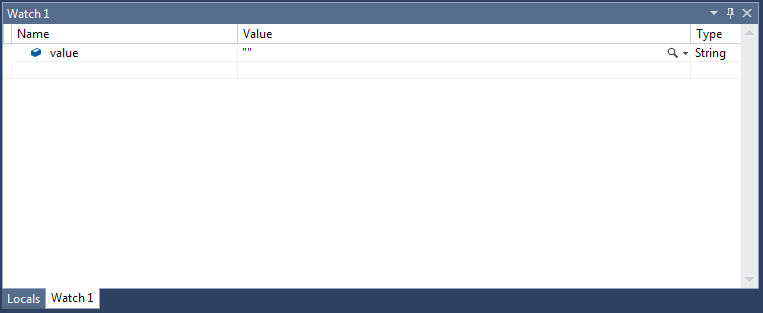
Местные жители
Панель «Локальные» отображает список переменных, находящихся в настоящее время в пределах области видимости, и связанных с ними значений. Она похожа на панель Watch, но автоматически создается Visual Studio. Панель «Локальные» удобна для идентификации локальных переменных и избавляет вас от явного добавления их в список наблюдения.

Консоль JavaScript
Наконец, вкладка «Консоль JavaScript» — отличный инструмент для проверки значений выражений и экспериментов с кодом. Просто вернитесь на вкладку консоли JavaScript, введите код и нажмите Enter. Visual Studio выполнит код в контексте и области действия текущей точки останова.
Шаг 7. Исправьте ошибку
Переключитесь на вкладку «Консоль JavaScript» и начнем разбирать строку, вызвавшую ошибку, чтобы вы могли исправить ее с помощью вкладки «Консоль JavaScript».
Во-первых, проверьте вывод вызова value.split(‘’), чтобы вы могли получить первый символ, а затем вызвать для него функцию toUpperCase.
Выполнение выражения в консоли JavaScript показывает, что оно возвращает пустой массив — отсюда и ошибка! Поскольку он возвращает пустой массив, и мы пытаемся вызвать toUpperCase для первого элемента (который не определен, поскольку элементов нет), это дает вам ошибку.
Вы можете убедиться в этом, введя полное выражение в консоль JavaScript:

Итак, чтобы решить проблему, вам нужно проверить, что строка пуста или не определена. Если это так, вам нужно вернуть пустую строку обратно без какой-либо обработки.

На этом краткое введение в отладку JavaScript в Visual Studio завершено. Хотя Visual Studio в первую очередь известна как серверная IDE, она очень многофункциональна, когда дело доходит до отладки JavaScript.
Если вы уже работаете с Visual Studio, то иметь одну среду отладки для внутреннего и внешнего кода будет огромным преимуществом.
Первоначально опубликовано на raygun.com.