
1. Overview
The Linux operating system, and many applications that run on it, do a lot of logging. These logs are invaluable for monitoring and troubleshooting your system.
What you’ll learn
- Viewing logs with a simple GUI tool
- Basic command-line commands for working with log files
What you’ll need
- Ubuntu Desktop or Server
- Very basic command-line knowledge (
cd,ls, etc.)
Originally authored by Ivan Fonseca.
How will you use this tutorial?
-
Only read through it
Read it and complete the exercises
What is your current level of experience?
-
Novice
Intermediate
Proficient
2. Log files locations
There are many different log files that all serve different purposes. When trying to find a log about something, you should start by identifying the most relevant file. Below is a list of common log file locations.
System logs
System logs deal with exactly that — the Ubuntu system — as opposed to extra applications added by the user. These logs may contain information about authorizations, system daemons and system messages.
Authorization log
Location: /var/log/auth.log
Keeps track of authorization systems, such as password prompts, the sudo command and remote logins.
Daemon Log
Location: /var/log/daemon.log
Daemons are programs that run in the background, usually without user interaction. For example, display server, SSH sessions, printing services, bluetooth, and more.
Debug log
Location: /var/log/debug
Provides debugging information from the Ubuntu system and applications.
Kernel log
Location: /var/log/kern.log
Logs from the Linux kernel.
System log
Location: /var/log/syslog
Contains more information about your system. If you can’t find anything in the other logs, it’s probably here.
Application logs
Some applications also create logs in /var/log. Below are some examples.
Apache logs
Location: /var/log/apache2/ (subdirectory)
Apache creates several log files in the /var/log/apache2/ subdirectory. The access.log file records all requests made to the server to access files. error.log records all errors thrown by the server.
X11 server logs
Location: /var/log/Xorg.0.log
The X11 server creates a seperate log file for each of your displays. Display numbers start at zero, so your first display (display 0) will log to Xorg.0.log. The next display (display 1) would log to Xorg.1.log, and so on.
Non-human-readable logs
Not all log files are designed to be read by humans. Some were made to be parsed by applications. Below are some of examples.
Login failures log
Location: /var/log/faillog
Contains info about login failures. You can view it with the faillog command.
Last logins log
Location: /var/log/lastlog
Contains info about last logins. You can view it with the lastlog command.
Login records log
Location: /var/log/wtmp
Contains login info used by other utilities to find out who’s logged in. To view currently logged in users, use the who command.
This is not an exhaustive list!
You can search the web for more locations relevant to what you’re trying to debug. There is also a longer list here.
3. Viewing logs using GNOME System Log Viewer
The GNOME System Log Viewer provides a simple GUI for viewing and monitoring log files. If you’re running Ubuntu 17.10 or above, it will be called Logs. Otherwise, it will be under the name System Log.
System Log Viewer interface

The log viewer has a simple interface. The sidebar on the left shows a list of open log files, with the contents of the currently selected file displayed on the right.
The log viewer not only displays but also monitors log files for changes. The bold text (as seen in the screenshot above) indicates new lines that have been logged after opening the file. When a log that is not currently selected is updated, it’s name in the file list will turn bold (as shown by auth.log in the screenshot above).
Clicking on the cog at the top right of the window will open a menu allowing you to change some display settings, as well as open and close log files.
There is also a magnifying glass icon to the right of the cog that allows you to search within the currently selected log file.
More information
If you wish to learn more about the GNOME System Log Viewer, you may visit the official documentation.
4. Viewing and monitoring logs from the command line
It is also important to know how to view logs in the command line. This is especially useful when you’re remotely connected to a server and don’t have a GUI.
The following commands will be useful when working with log files from the command line.
Viewing files
The most basic way to view files from the command line is using the cat command. You simply pass in the filename, and it outputs the entire contents of the file: cat file.txt.
This can be inconvenient when dealing with large files (which isn’t uncommon for logs!). We could use an editor, although that may be overkill just to view a file. This is where the less command comes in. We pass it the filename (less file.txt), and it will open the file in a simple interface. From here, we can use the arrow keys (or j/k if you’re familiar with Vim) to move through the file, use / to search, and press q to quit. There are a few more features, all of which are described by pressing h to open the help.
Viewing the start or end of a file
We may also want to quickly view the first or last n number of lines of a file. This is where the head and tail commands come in handy. These commands work much like cat, although you can specify how many lines from the start/end of the file you want to view. To view the first 15 lines of a file, we run head -n 15 file.txt, and to view the last 15, we run tail -n 15 file.txt. Due to the nature of log files being appended to at the bottom, the tail command will generally be more useful.
Monitoring files
To monitor a log file, you may pass the -f flag to tail. It will keep running, printing new additions to the file, until you stop it (Ctrl + C). For example: tail -f file.txt.
Searching files
One way that we looked at to search files is to open the file in less and press /. A faster way to do this is to use the grep command. We specify what we want to search for in double quotes, along with the filename, and grep will print all the lines containing that search term in the file. For example, to search for lines containing “test” in file.txt, you would run grep "test" file.txt.
If the result of a grep search is too long, you may pipe it to less, allowing you to scroll and search through it: grep "test" file.txt | less.
Editing files
The simplest way to edit files from the command line is to use nano. nano is a simple command line editor, which has all the most useful keybindings printed directly on screen. To run it, just give it a filename (nano file.txt). To close or save a file, press Ctrl + X. The editor will ask you if you want to save your changes. Press y for yes or n for no. If you choose yes, it will ask you for the filename to save the file as. If you are editing an existing file, the filename will already be there. Simply leave it as it is and it will save to the proper file.
5. Conclusion
Congratulations, you now have enough knowledge of log file locations, usage of the GNOME System Log Viewer and basic command line commands to properly monitor and trouble-shoot problems that arise on your system.
Further reading
- The Ubuntu Wiki has an article that goes more in-depth into Ubuntu log files.
- This DigitalOcean Community article covers viewing Systemd logs
Was this tutorial useful?
Thank you for your feedback.
Приветствую читателей своего сайта. Сегодня я всесторонне рассмотрю тему тему логов в Ubuntu — ошибки, загрузка, системные логи, cron и остальное. Постараюсь дать обзорную информацию по основным моментам в этой теме. Материал в основном рассчитан на новичков, но возможно восполнит пробелы и специалистов.
Традиционно логи в Linux хранятся в директории /var/log. Вот описание стандартных лог файлов Ubuntu, которые там присутствуют. Кстати, если вы только планируете устанавливать ubuntu, то можете воспользоваться моей подробной статьей на этот счет — установка ubuntu server. Так же вам может быть интересен мой обзор и сравнение сервера убунту с другими linux системами — Ubuntu Server — обзор для начинающих, сравнение, отзывы.
- syslog или messages. Последнего чаще всего нет и вместо него только syslog. Это традиционные глобальные системные журналы операционной системы linux. Сюда пишутся события загрузки, ядра системы, системы инициализации systemd и т.д.
- auth.log — лог авторизации и аутентификации в системе.
- dmesg — в этом логе хранится информация о загрузке ядра и драйверов оборудования.
- alternatives.log — лог файл программы update-alternatives. Не знаю, за какие такие заслуги ей выделили отдельный лог файл, а cron, к примеру, нет.
- kern.log — лог сообщений ядра ubuntu, да и любой другой linux системы.
- maillog — сообщения почтовой системы. Обычно postfix или exim. Если на сервере ubuntu они не установлены, то и почтового лога не будет.
- dpkg.log — логирование работы пакетных менеджеров ubuntu. Обычно это apt или apt-get.
- lastlog и wtmp — информация о прошлых авторизациях пользователей.
Лог загрузки
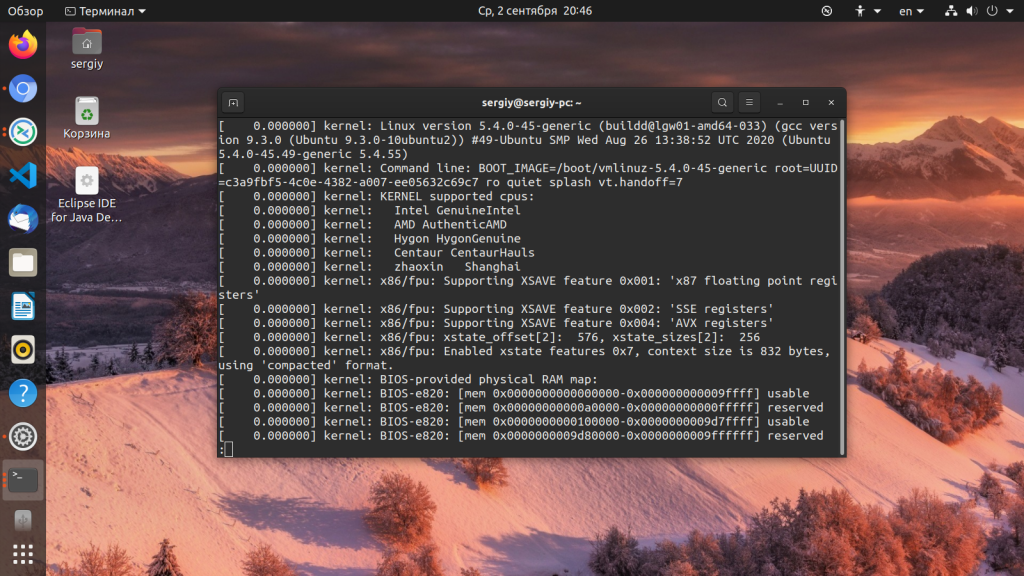
Начнем с самого начала. В момент загрузки системы записывается вся основная информация, имеющая к ней отношение. Если у вас будут какие-то ошибки во время старта сервера, вы сможете их увидеть в этом логе. Посмотреть лог загрузки Ubuntu можно следующим образом.
sudo dmesg
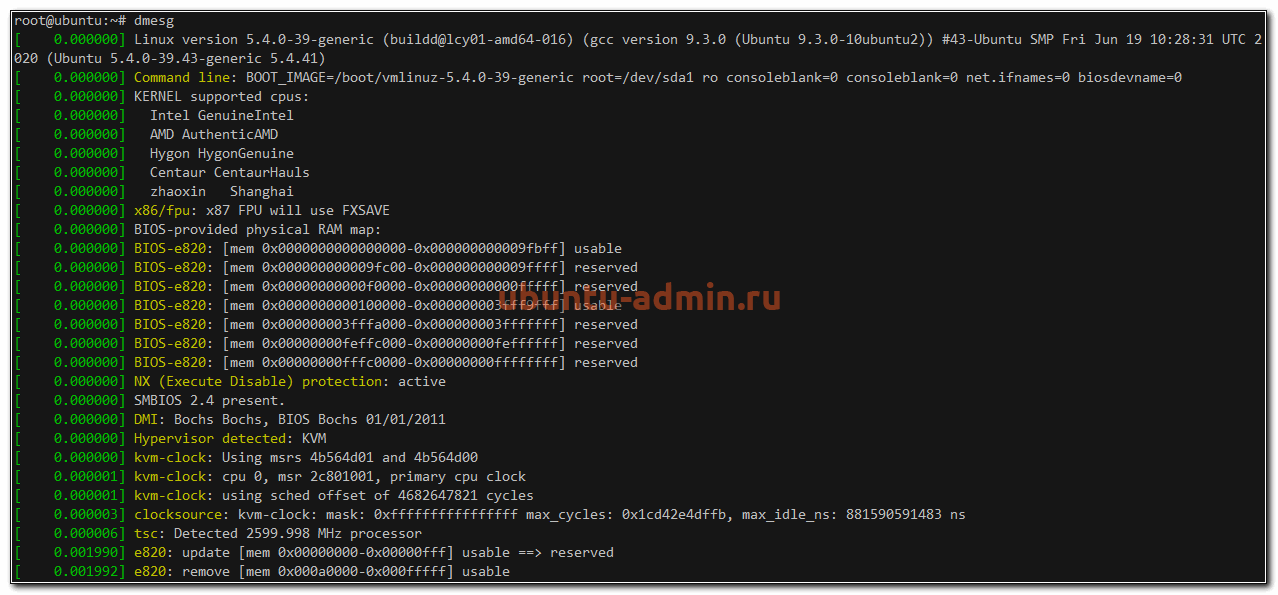
У вас получится очень длинный вывод всего того, что происходило с системой на старте. Если ищите что-то конкретное, то можете сделать фильтрацию вывода с помощью grep. Допустим, вам надо узнать информацию только о диске.
sudo dmesg | grep sda
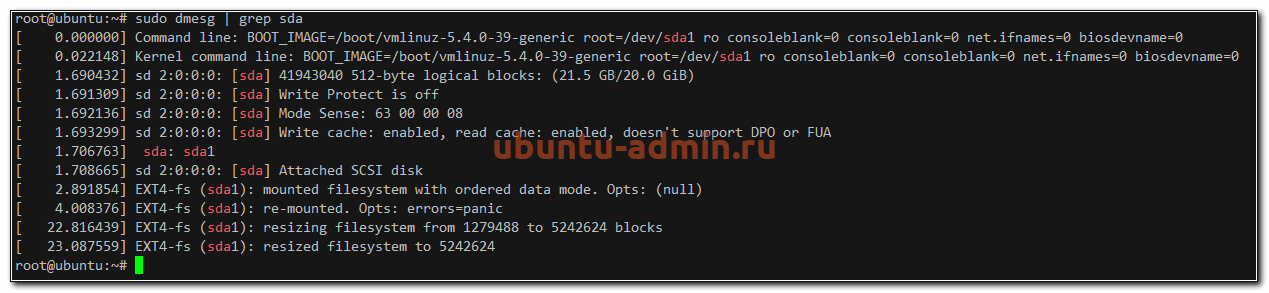
Вы увидите лог загрузки системы ubuntu, содержащий информацию только о диске sda. Аналогичным образом можно фильтровать вывод по другим темам. Например, посмотреть все ошибки, которые были во время загрузки.
sudo dmesg | grep error
И так далее. Информация, которую выводит команда dmesg, хранится в log файле /var/log/dmesg.
Логи авторизации, в том числе ssh
Для того, чтобы узнать, кто и когда проходил авторизацию на сервере ubuntu, можно воспользоваться логами из файла /var/log/auth.log. Авторизация по ssh там будет выглядеть следующим образом.
sshd[2774]: Accepted publickey for root from 21.17.214.129 port 2673 ssh2: RSA SHA256:MCDja9Ve7rYZCzeVGpYXpqRxfAanWwVkcd+lU3GS
sshd[2774]: pam_unix(sshd:session): session opened for user root by (uid=0)
systemd-logind[628]: New session 6 of user root.

Здесь мы видим ip адрес, с которого произошло подключение и слепок сертификата, так как аутентификация была произведена с его помощью. Если хотите повысить уровень логирования подключений по ssh и получать больше информации, то можете отредактировать конфигурационный файл sshd — /etc/ssh/sshd_config, добавив туда следующий параметр.
LogLevel VERBOSE
Не забудьте перезапустить службу sshd для принятия изменений:
sudo systemctl restart sshd
После этого логирование подключений по ssh будет более подробное.
Лог локального входа в ubuntu тоже хранится в файле auth.log. Информация о подключении через консоль выглядит следующим образом.
login[680]: pam_unix(login:session): session opened for user root by LOGIN(uid=0)
systemd-logind[628]: New session 9 of user root.
login[3094]: ROOT LOGIN on '/dev/tty1'
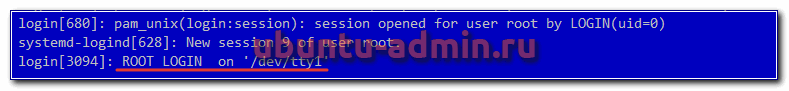
Устройство /dev/tty1 говорит о том, что вход локальный.
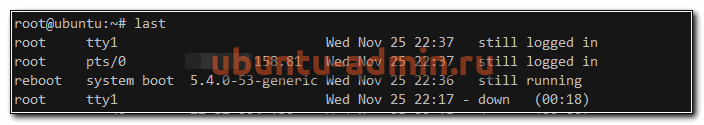
Вы можете быстро посмотреть информацию о последних входах в систему с помощью команды last. Эта информация хранится в бинарном логе /var/log/lastlog.
Примерно то же самое можно увидеть с помощью utmpdump.
sudo utmpdump /var/log/wtmp
Логи ошибок в Ubuntu
Рассмотрим теперь вопрос с расположением лога ошибок в Ubuntu. Как такового отдельного error log в традиционных linux системах нет. И Убунта тут не исключение. Ошибки придется искать по системным и программным логам выборкой ключевых слов. Обычно используют следующие фразы:
- error или err
- critical или crit
- debug
- warn
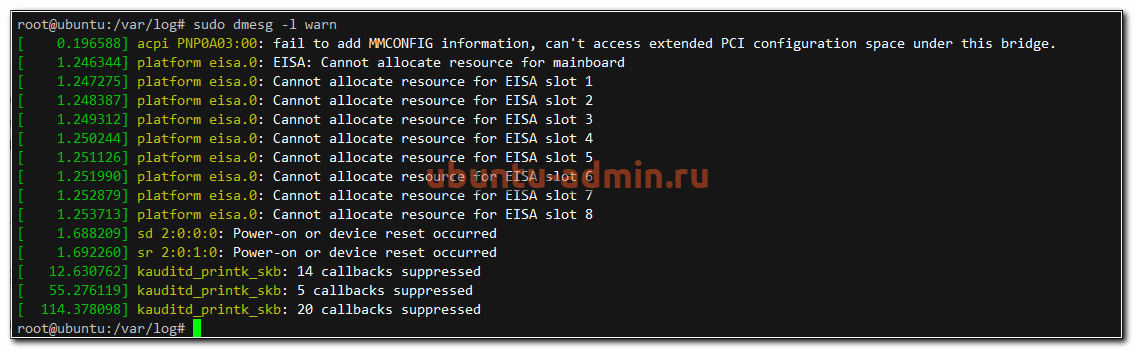
Например, посмотрим в логе загрузки dmesg все сообщения уровня предупреждений (warn).
sudo dmesg -l warn
А теперь проверим ошибки в системном логе.
sudo cat /var/log/syslog | grep error
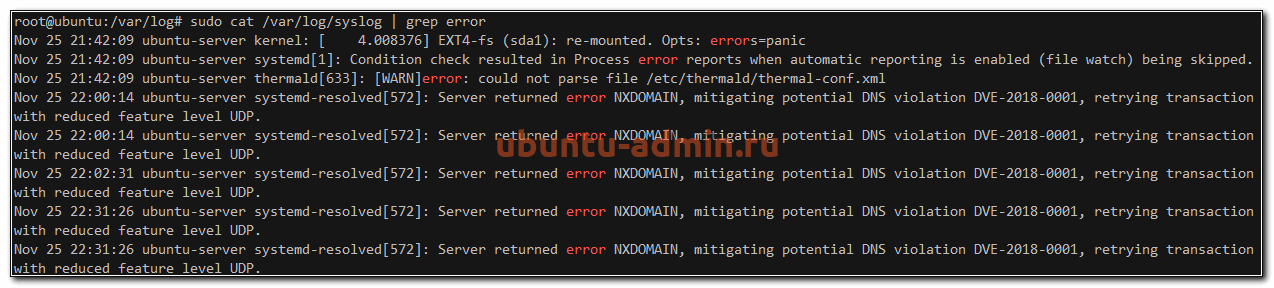
Видим некоторые ошибки в службе systemd-resolved.
Cron logs
Часто хочется проверить лог запуска периодических заданий cron. В Ubuntu, как мне кажется, сделали не удобно. По умолчанию, cron logs не выделены в отдельный файл. Искать их стоит в общем системном логе syslog. Например, в Centos существует отдельный лог-файл /var/log/cron, где собрана вся информация о запущенных заданиях. Предлагаю сделать так же в Ubuntu.
Для этого открываем конфигурационный файл /etc/rsyslog.d/50-default.conf и добавляем туда следующую информацию.
cron.* /var/log/cron.log
По умолчанию, она присутствует в конфиге, но закомментирована. Вам нужно убрать # в начале строки, чтобы раскомментировать ее. Так же я рекомендую сделать так, чтобы эти логи не дублировались в общий системный лог. Для этого немного измените следующую строку.
*.*;auth,authpriv.none,cron.none -/var/log/syslog
Я добавил в нее cron.none, чтобы логи cron не писались больше в системный лог syslog. После этого перезапустите службы rsyslog и cron и проверяйте изменения.
sudo systemctl restart rsyslog
sudo systemctl restart cron
Проверяем cron.log
sudo cat /var/log/cron.log
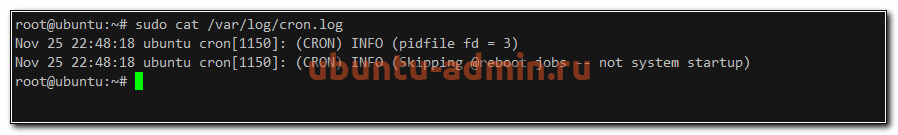
Теперь у нас все логи Cron в Ubuntu будут в отдельном файле.
Лог действий пользователя
Мне часто задают вопросы, как посмотреть лог действий пользователя в системе или как узнать, какие программы он запускал. По умолчанию, такие действия не логируются в ubuntu. Для этого нужно устанавливать какое-то дополнительное программное обеспечение. Я даже не знаю, кто умеет это делать. Обычно если надо фиксировать действия пользователя, включается лог работы sudo.
Для того, чтобы включить логирование действий пользователя через sudo, редактируем файл /etc/sudoers. Добавляем туда строку.
Defaults logfile=/var/log/sudo.log
Теперь выполните какую-нибудь команду через sudo.
sudo cat /var/log/cron.log
Проверяем sudo.log.
Nov 25 23:10:36 : root : TTY=pts/3 ; PWD=/root ; USER=root ;
    COMMAND=/usr/bin/cat /var/log/cron.log
Выполненная команда пользователя сохранена в логе sudo.log. Теперь никто не сможет выполнить незаметно административные действия на сервере. Конечно, человек с полными правами сможет изменить любой лог файл, удалив свои действия при желании. Для этого важные логи нужно отправлять куда-то в другое место, но это уже тема отдельной статьи.
На сегодня по логам в Ubuntu у меня все. Желаю вам логов без ошибок и вечного аптайма (шутка, надо ставить обновы и перезагружаться).

Journalctl — отличный инструмент для анализа логов, обычно один из первых с которым знакомятся начинающие администраторы linux систем. Встроенные возможности ротации, богатые возможности фильтрации и возможность просматривать логи всех systemd unit-сервисов одним инструментом очень удобны и заметно облегчают работу системным администраторам.
Эта статья рассматривает основные возможности утилиты journalctl и различные варианты ее применения. С помощью journalctl можно просматривать логи системы, чтобы решить возникшие проблемы на рабочей станции или сервере использующие дистрибутив linux с демоном инициализации systemd, де-факто уже ставшим стандартом в современных Linux-системах, например: RHEL, CentOS, Fedora, Debian и многих других.
Существует мнение, что systemd не так уж и хорош — он нагружает систему и это все еще предмет для споров на сегодняшний день, но нельзя отрицать, что он предоставляет прекрасный набор инструментов для управления системой и поиска проблем. Представьте, что вам приходится иметь дело с проблемным сервером, который даже не загружается — в таком случае можно загрузиться с live-дистрибутива, смонтировать системный раздел и просмотреть логи systemd, чтобы понять, в чем проблема.
Systemd
Systemd состоит из трех основных компонентов:
- systemd — менеджер системы и сервисов
- systemctl — утилита для просмотра и управление статусом сервисов
- systemd-analyze — предоставляет статистику по процессу загрузки системы, проверяет корректность unit-файлов и так же имеет возможности отладки systemd
Journald
Journald — системный демон журналов systemd. Systemd спроектирован так, чтобы централизованно управлять системными логами от процессов, приложений и т.д. Все такие события обрабатываются демоном journald, он собирает логи со всей системы и сохраняет их в бинарных файлах.
Преимуществ централизованного логирования событий в бинарном формате достаточно много, например системные логи можно транслировать в различные форматы, такие как простой текст, или в JSON, при необходимости. Так же довольно просто можно отследить лог вплоть до одиночного события используя фильтры даты и времени.
Файлы логов journald могут собирать тысячи событий и они обновляются с каждым новым событием, поэтому если ваша Linux-система работает достаточно долго — размер файлов с логами может достигать несколько гигабайт и более. Поэтому анализ таких логов может происходить с задержками, в таком случае, при анализе логов можно фильтровать вывод, чтобы ускорить работу.
Файл конфигурации journald
Файл конфигурации можно найти по следующему пути: /etc/systemd/journald.conf, он содержит различные настройки journald, я бы не рекомендовал изменять этот файл, если вы точно не уверены в том, что делаете.
Каталог с журналом journald располагается /run/log/journal (в том случае, если не настроено постоянное хранение журналов, но об этом позже).
Файлы хранятся в бинарном формате, поэтому нормально их просмотреть с помощью cat или nano, как привыкли многие администраторы — не получится.
Использование journalctl для просмотра и анализа логов
Основная команда для просмотра:
# journalctl
Она выведет все записи из всех журналов, включая ошибки и предупреждения, начиная с того момента, когда система начала загружаться. Старые записи событий будут наверху, более новые — внизу, вы можете использовать PageUp и PageDown чтобы перемещаться по списку, Enter — чтобы пролистывать журнал построчно и Q — чтобы выйти.
По умолчанию journalctl выводит время событий согласно настроенного в вашей системе часового пояса, также journalctl позволяет просмотреть логи с временем UTC (в этом стандарте времени сохраняются события внутри файлов journald), для этого можно использовать команду:
# journalctl --utc
Фильтрация событий по важности
Система записывает события с различными уровнями важности, какие-то события могут быть предупреждением, которое можно проигнорировать, какие-то могут быть критическими ошибками. Если мы хотим просмотреть только ошибки, игнорируя другие сообщения, введем команду с указанием кода важности:
# journalctl -p 0
Для уровней важности, приняты следующие обозначения:
- 0: emergency (неработоспособность системы)
- 1: alerts (предупреждения, требующие немедленного вмешательства)
- 2: critical (критическое состояние)
- 3: errors (ошибки)
- 4: warning (предупреждения)
- 5: notice (уведомления)
- 6: info (информационные сообщения)
- 7: debug (отладочные сообщения)
Когда вы указываете код важности, journalctl выведет все сообщения с этим кодом и выше. Например если мы укажем опцию -p 2, journalctl покажет все сообщения с уровнями 2, 1 и 0.
Настройка хранения журналов
По умолчанию journald перезаписывает свои журналы логов при каждой перезагрузке, и вызов journalctl выведет журнал логов начиная с текущей загрузки системы.
Если необходимо настроить постоянное сохранение логов, потребуется отдельно это настроить, т.к. разработчики отказались от постоянного хранения всех журналов, чтобы не дублировать rsyslog.
Когда в конфигурационном файле /etc/systemd/journald.conf параметру Storage= задано значение auto) и каталога /var/log/journal/ не существует, журнал будет записываться в /run/log/journal без сохранения между перезагрузками, если /var/log/journal/ существует, журналы будут сохраняться в нем, на постоянной основе, но если каталог будет удален, systemd не пересоздаст его автоматически и вместо этого будет вести журнал снова в /run/systemd/journal без сохранения. Каталог может быть пересоздан в таком случае, если добавить Storage=persistent в journald.conf и перезапустить systemd-journald.service (или перезагрузиться).
Создадим каталог для хранения журналов, установим необходимые атрибуты и перезапустим службу:
# mkdir /var/log/journal
# systemd-tmpfiles --create --prefix /var/log/journal
# systemctl restart systemd-journald
Просмотр журналов загрузки
Если journald был настроен на постоянное хранение журналов, мы можем просматривать журналы логов по каждой отдельной загрузке, следующая команда выведет список журналов:
# journalctl --list-boots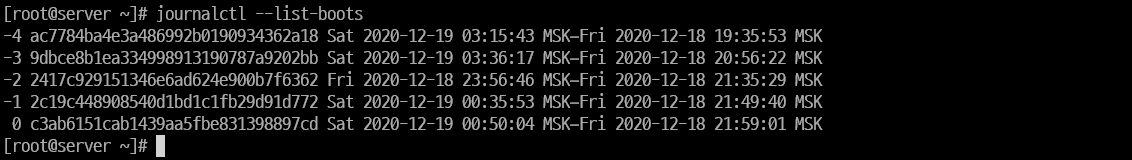
Первый номер показывает номер журнала, который можно использовать для просмотра журнала определенной сессии. Второй номер boot ID так же можно использовать для просмотра отдельного журнала.
Следующие две даты, промежуток времени в течении которого в него записывались логи, это удобно если вы хотите найти логи за определенный период.
Например, чтобы просмотреть журнал начиная с текущего старта системы, можно использовать команду:
# journalctl -b 0А для того, чтобы просмотреть журнал предыдущей загрузки:
# journalctl -b -1Просмотр журнала за определенный период времени
Journalctl позволяет использовать такие служебные слова как “yesterday” (вчера), “today” (сегодня), “tomorrow” (завтра), или “now” (сейчас).
Поэтому мы можем использовать опцию «—since» (с начала какого периода выводить журнал).
С определенной даты и времени:
# journalctl --since "2020-12-18 06:00:00"С определенной даты и по определенное дату и время:
# journalctl --since "2020-12-17" --until "2020-12-18 10:00:00Со вчерашнего дня:
# journalctl --since yesterdayС 9 утра и до момента, час назад:
# journalctl --since 09:00 --until "1 hour ago"Просмотр сообщений ядра
Чтобы просмотреть сообщения от ядра Linux за текущую загрузку, используйте команду с ключом -k:
# journalctl -k
Просмотр журнала логов для определенного сервиса systemd или приложения
Вы можете отфильтровать логи по определенному сервису systemd. Например, что бы просмотреть логи от NetworkManager, можно использовать следующую команду:

# journalctl -u NetworkManager.serviceЕсли нужно найти название сервиса, используйте команду:
# systemctl list-units --type=serviceТак же можно просмотреть лог приложения, указав его исполняемый файл, например чтобы просмотреть все сообщения от nginx за сегодня, мы можем использовать команду:
# journalctl /usr/sbin/nginx --since todayИли указав конкретный PID:
# journalctl _PID=1Дополнительные опции просмотра
Следить за появлением новых сообщений (аналог tail -f):
# journalctl -fОткрыть журнал «перемотав» его к последней записи:
# journalctl -eЕсли в каталоге с журналами очень много данных, то фильтрация вывода journalctl может занять некоторое время, процесс можно значительно ускорить с помощью опции —file, указав journalctl только нужный нам журнал, за которым мы хотим следить:
journalctl --file /var/log/journal/e02689e50bc240f0bb545dd5940ac213/system.journal -fПо умолчанию journalctl отсекает части строк, которые не вписываются в экран по ширине, хотя иногда перенос строк может оказаться более предпочтительным. Управление этой возможностью производится посредством переменной окружения SYSTEMD_LESS, в которой содержатся опции, передаваемые в less (программу постраничного просмотра, используемую по умолчанию). По умолчанию переменная имеет значение FRSXMK, если убрать опцию S, строки не будут обрезаться.
Например:
SYSTEMD_LESS=FRXMK journalctlОграничение размера журнала
Если journald настроен что бы сохранять журналы после перезагрузки, то по умолчанию размер журнала ограничен 10% от объема файлового раздела и максимально может занять 4 Гб дискового пространства.
Максимальный объем журнала можно скорректировать, раскомментировав и отредактировав следующий параметр в файле конфигурации journald:
SystemMaxUse=50MУдаление журналов
Удалить файлы архивных журналов, можно вручную с помощью rm или использовав journalctl.
Удалить журналы, оставив только последние 100 Мб:
# journalctl --vacuum-size=100MУдалить журналы, оставив журналы только за последние 7 дней:
# journalctl --vacuum-time=7dЗаключение
Служба журналирования логов journald очень мощный и гибкий инструмент, и если вы знаете как его использовать, он может сделать вашу жизнь намного проще во время поиска причин проблем с системой или ее сервисами.


Системные администраторы, да и обычные пользователи Linux, часто должны смотреть лог файлы для устранения неполадок. На самом деле, это первое, что должен сделать любой сисадмин при возникновении любой ошибки в системе.
Сама операционная система Linux и работающие приложения генерируют различные типы сообщений, которые регистрируются в различных файлах журналов. В Linux используются специальное программное обеспечение, файлы и директории для хранения лог файлов. Знание в каких файлах находятся логи каких программ поможет вам сэкономить время и быстрее решить проблему. В этой статье мы рассмотрим основные части системы логирования в Linux, файлы логов, а также утилиты, с помощью которых можно посмотреть логи Linux.
Расположение логов по умолчанию
Большинство файлов логов Linux находятся в папке /var/log/ вы можете список файлов логов для вашей системы с помощью команды ls:
ls -l /var/log/
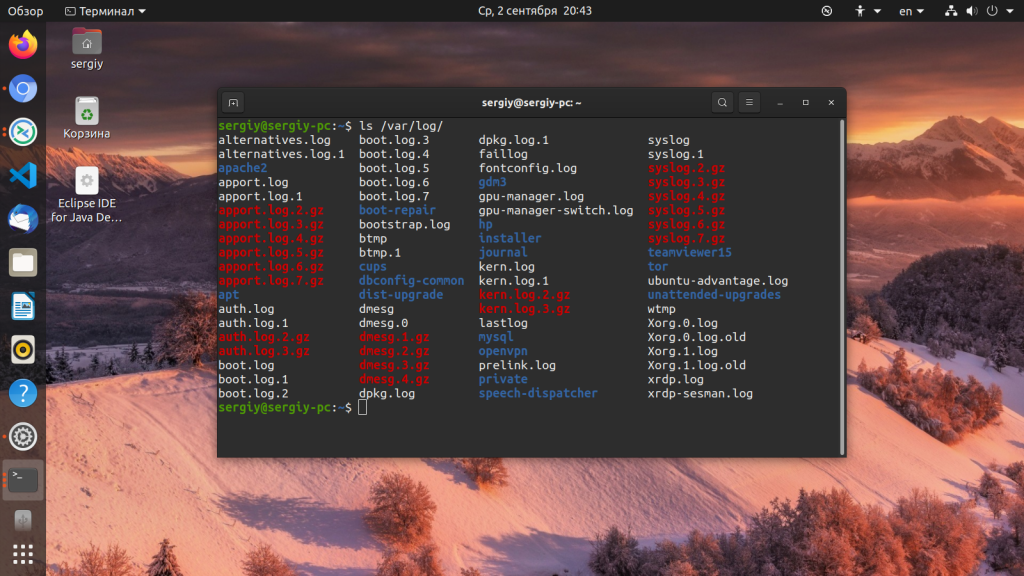
Ниже мы рассмотрим 20 различных файлов логов Linux, размещенных в каталоге /var/log/. Некоторые из этих логов встречаются только в определенных дистрибутивах, например, dpkg.log встречается только в системах, основанных на Debian.
- /var/log/messages — содержит глобальные системные логи Linux, в том числе те, которые регистрируются при запуске системы. В этот лог записываются несколько типов сообщений: это почта, cron, различные сервисы, ядро, аутентификация и другие.
- /var/log/dmesg — содержит сообщения, полученные от ядра. Регистрирует много сообщений еще на этапе загрузки, в них отображается информация об аппаратных устройствах, которые инициализируются в процессе загрузки. Можно сказать это еще один лог системы Linux. Количество сообщений в логе ограничено, и когда файл будет переполнен, с каждым новым сообщением старые будут перезаписаны. Вы также можете посмотреть сообщения из этого лога с помощью команды dmseg.
- /var/log/auth.log — содержит информацию об авторизации пользователей в системе, включая пользовательские логины и механизмы аутентификации, которые были использованы.
- /var/log/boot.log — Содержит информацию, которая регистрируется при загрузке системы.
- /var/log/daemon.log — Включает сообщения от различных фоновых демонов
- /var/log/kern.log — Тоже содержит сообщения от ядра, полезны при устранении ошибок пользовательских модулей, встроенных в ядро.
- /var/log/lastlog — Отображает информацию о последней сессии всех пользователей. Это нетекстовый файл, для его просмотра необходимо использовать команду lastlog.
- /var/log/maillog /var/log/mail.log — журналы сервера электронной почты, запущенного в системе.
- /var/log/user.log — Информация из всех журналов на уровне пользователей.
- /var/log/Xorg.x.log — Лог сообщений Х сервера.
- /var/log/alternatives.log — Информация о работе программы update-alternatives. Это символические ссылки на команды или библиотеки по умолчанию.
- /var/log/btmp — лог файл Linux содержит информацию о неудачных попытках входа. Для просмотра файла удобно использовать команду last -f /var/log/btmp
- /var/log/cups — Все сообщения, связанные с печатью и принтерами.
- /var/log/anaconda.log — все сообщения, зарегистрированные при установке сохраняются в этом файле
- /var/log/yum.log — регистрирует всю информацию об установке пакетов с помощью Yum.
- /var/log/cron — Всякий раз когда демон Cron запускает выполнения программы, он записывает отчет и сообщения самой программы в этом файле.
- /var/log/secure — содержит информацию, относящуюся к аутентификации и авторизации. Например, SSHd регистрирует здесь все, в том числе неудачные попытки входа в систему.
- /var/log/wtmp или /var/log/utmp — системные логи Linux, содержат журнал входов пользователей в систему. С помощью команды wtmp вы можете узнать кто и когда вошел в систему.
- /var/log/faillog — лог системы linux, содержит неудачные попытки входа в систему. Используйте команду faillog, чтобы отобразить содержимое этого файла.
- /var/log/mysqld.log — файлы логов Linux от сервера баз данных MySQL.
- /var/log/httpd/ или /var/log/apache2 — лог файлы linux11 веб-сервера Apache. Логи доступа находятся в файле access_log, а ошибок в error_log
- /var/log/lighttpd/ — логи linux веб-сервера lighttpd
- /var/log/conman/ — файлы логов клиента ConMan,
- /var/log/mail/ — в этом каталоге содержатся дополнительные логи почтового сервера
- /var/log/prelink/ — Программа Prelink связывает библиотеки и исполняемые файлы, чтобы ускорить процесс их загрузки. /var/log/prelink/prelink.log содержит информацию о .so файлах, которые были изменены программой.
- /var/log/audit/— Содержит информацию, созданную демоном аудита auditd.
- /var/log/setroubleshoot/ — SE Linux использует демон setroubleshootd (SE Trouble Shoot Daemon) для уведомления о проблемах с безопасностью. В этом журнале находятся сообщения этой программы.
- /var/log/samba/ — содержит информацию и журналы файлового сервера Samba, который используется для подключения к общим папкам Windows.
- /var/log/sa/ — Содержит .cap файлы, собранные пакетом Sysstat.
- /var/log/sssd/ — Используется системным демоном безопасности, который управляет удаленным доступом к каталогам и механизмами аутентификации.
Чтобы посмотреть логи на Linux удобно использовать несколько утилит командной строки Linux. Это может быть любой текстовый редактор, или специальная утилита. Скорее всего, вам понадобятся права суперпользователя для того чтобы посмотреть логи в Linux. Вот команды, которые чаще всего используются для этих целей:
- less;
- more;
- cat;
- head;
- grep;
- tail;
- zcat;
- zgrep;
- zmore;
- vi;
- nano.
Я не буду останавливаться подробно на каждой из этих команд, поскольку большинство из них уже подробно рассмотрены на нашем сайте. Но приведу несколько примеров. Просмотр логов Linux выполняется очень просто:
Смотрим лог /var/log/dmesg, с возможностью прокрутки:
less /var/log/dmesg
Просмотр логов Linux, в реальном времени:
tail -f /var/log/dmesg
Открываем лог файл dmesg:
cat /var/log/dmesg
Первые строки dmesg:
head /var/log/dmesg
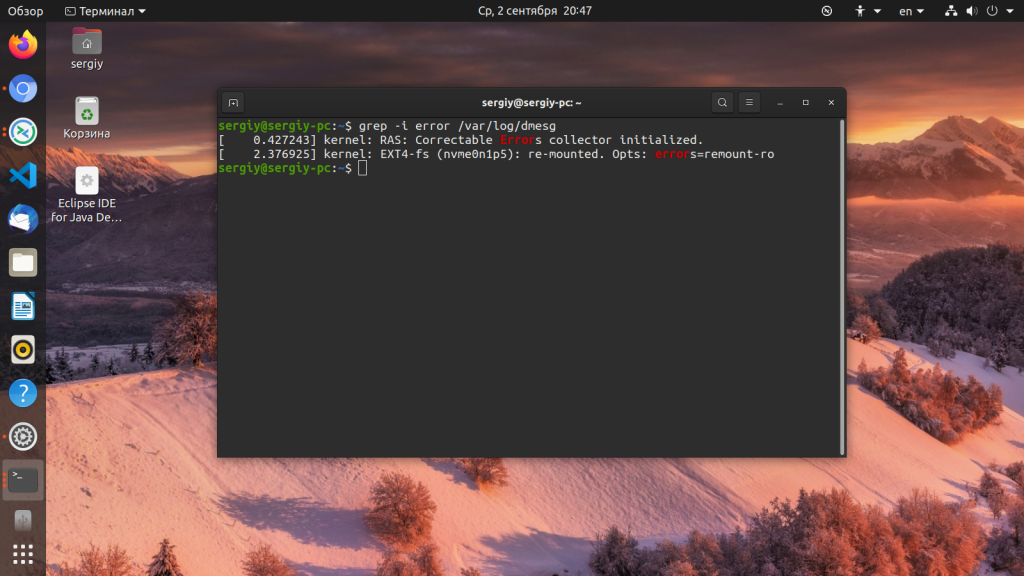
Выводим только ошибки из /var/log/messages:
grep -i error /var/log/dmesg
Кроме того, посмотреть логи на linux можно и с помощью графических утилит. Программа Журналы может быть использована для удобного просмотра и отслеживания системных журналов на ноутбуке или персональном компьютере с Linux.
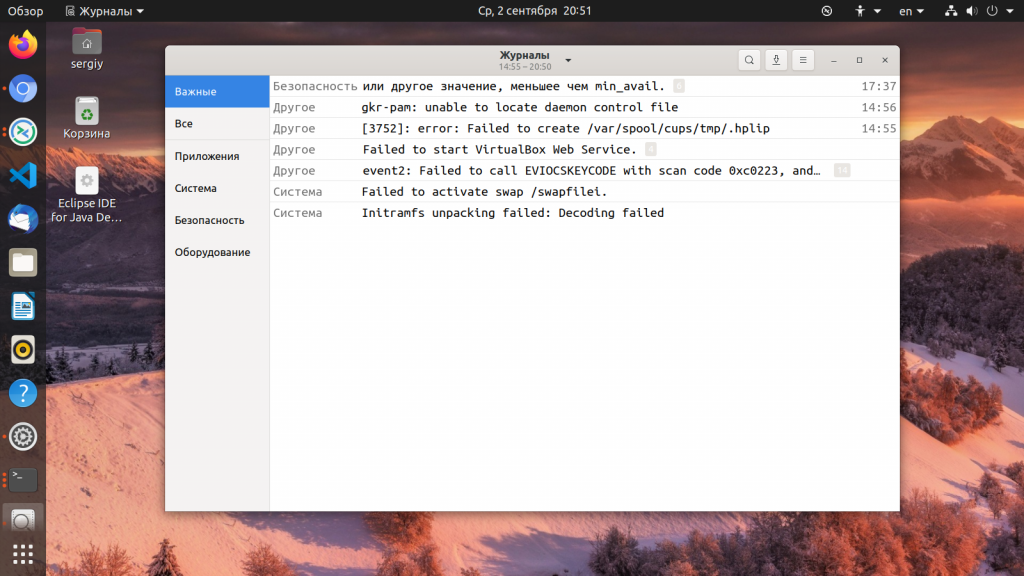
Вы можете установить программу в любой системе с установленным X сервером. Также для просмотра логов может использоваться любой графический тестовый редактор.
Кроме того, у каждого сервиса есть свой лог файл, который можно посмотреть с помощью утилиты journalctl.
Выводы
В каталоге /var/log вы можете найти всю необходимую информацию о работе Linux. Из сегодняшней статьи вы достаточно узнали, чтобы знать где искать, и что искать. Теперь просмотр логов в Linux не вызовет у вас проблем. Если остались вопросы, задавайте в комментариях!
Обнаружили ошибку в тексте? Сообщите мне об этом. Выделите текст с ошибкой и нажмите Ctrl+Enter.

Статья распространяется под лицензией Creative Commons ShareAlike 4.0 при копировании материала ссылка на источник обязательна .
Об авторе
![]()
Основатель и администратор сайта losst.ru, увлекаюсь открытым программным обеспечением и операционной системой Linux. В качестве основной ОС сейчас использую Ubuntu. Кроме Linux, интересуюсь всем, что связано с информационными технологиями и современной наукой.
Ubuntu provides extensive logging capabilities, so most of the activities happening in the system are tracked via logs. Ubuntu logs are valuable sources of information about the state of your Ubuntu operating system and the applications deployed on it. The majority of the logs are in plain text ASCII format and easily readable. This makes them a great tool to use for troubleshooting and identifying the root causes associated with system failures or application errors.
Due to the wide variety of system and application logs available, choosing the appropriate log sources and locating them within your system can be a daunting task. In this post, I’ll be taking you through the many types of Ubuntu logs, as well as how to view and analyze them.
What Are Ubuntu Logs?
Ubuntu logs record the events occurring in the hardware, software, and operating system, which aid in determining the underlying cause of any problems the system may experience.
In Ubuntu, there are two types of logs:
- System logs that provide insights on operating system functionalities like access control and system processes.
- Application logs are generated by the applications deployed in the system, offering information on their state.
Ubuntu Log Files Location: Where Are They Stored?
The root directory of the majority of log files is /var/log, while most system logs are generated by the syslog log daemon to capture activities. The OS will use syslog, whereas the majority of programs will log data to files in the /var/log subdirectory.
System Logs
System logs include details about the system and certain applications. Syslog usually stores its log files at /var/log/messages or /var/log/syslog.
Below are some key system logs and how to find them to help gain more insights into the health of your Ubuntu system and the applications running on it
Authorization Log
This log contains information about the authorization processes that happen in the system. This includes sudo commands, SSH logins, or any authentication modules used for collecting user credentials. You can find the authorization log file at /var/log/auth.log.
Daemon Log
Ubuntu systems have a number of daemons, which are effectively background services that offer certain functionalities, monitor the system, or support other processes. Some of the common daemons are systemd, logind, gcfsv, etc. They could also be application-specific daemons like mysqld. These logs are routed to the /var/log/daemon.log file and can help you investigate issues associated with their respective daemons.
Debug Log
Systems use the syslogd protocol to send log messages to a central location. The debug log stores the debug messages sent to syslogd at the DEBUG level by applications or Ubuntu system components. You can find the debug log at /var/log/debug.
Kernel Log
This log captures events or messages related to the Linux kernel. The information available in this log helps administrators investigate kernel-level issues in Ubuntu and you can find it at /var/log/kern/log.
Kernel Ring Buffer
The kernel ring buffer is a data structure that lets you store information related to kernel operations in Ubuntu. It is not a log file but rather a constant-size buffer where the oldest messages are removed to make space for new messages. The messages can be queries using the following command:
dmesg | less
System Log
The system log contains exhaustive information about the state of an Ubuntu system. It’s found at /var/log/syslog, the default location referred to by administrators when required information is not found in other log files. Applications or services that do not have their own log files use this file to store logging information. It also contains logs that used to be saved in /var/log/messages in older versions of Ubuntu.
Service Log
In Ubuntu, service logs are system logs that capture information about the state of your services. You can look into an event logged by the daemon systemd-journald if logs about a specific service are not found in /var/log. This daemon publishes a single stream combining the log outputs from all services to the central journal in /{run,var}/log/journal/. To view data for a specific service, use the following command:
journalctl -f -u {service name}
Cron Log
The cron daemon reads crontab files and runs scheduled operations in the background. The logs it produces are useful for debugging and auditing cron jobs. The Ubuntu crontab log can be found in /var/log/syslog. The following command lets you view cron job-specific entries in the file:
grep CRON /var/log/syslog
Network Log
The NetworkManager service manages network connectivity in Ubuntu systems. By default, the log files generated by NetworkManager are streamed to /var/log/syslog. For the latest versions of Ubuntu, you can view the logs with the command:
journalctl /usr/sbin/NetworkManager
Audit Log
Audit information about Ubuntu systems is provided by auditd, the Linux audit daemon. The default location of the auditd log file is /var/log/audit/audit.log. This also allows you to view commands like ausearch and aureport to parse and analyze audit logs.
Startup Log
System boot logs are located in /var/log/boot.log. To read the most recent boot log messages on Ubuntu operating systems that use systemd, use the journalctl command as below:
journalctl -b
Crash Log
The Ubuntu Kernel Crash Dump mechanism collects the state and memory of the kernel when a system crashes. This data is saved to /var/crash and helps in identifying the root cause of the crash.
Firewall Log
Firewall logs are necessary for identifying odd network activities, spotting attacks, and debugging firewall rules. The Ubuntu firewall logs associated with the default firewall service UFW can be found in the /var/log folder. You can manage the location of the logs by editing the Ubuntu syslog config file available at /etc/syslog.conf.
Journal Log
Journald is the log management service daemon in Ubuntu. Go ahead and edit the location of the logging file in /etc/systemd/journald.conf. To view the logging data captured by journald, use the journalctl command.
Error Log
Error logs provide useful information about issues happening in application and system components. Error log files specific to an application or service are available in the /var/log folder.
SSH Log
Information about user logins and usage of sudo commands in SSH is also stored in the authorization logs. You can search the files to get information about SSH logs using the following command:
grep sshd /var/log/auth.log | less
Application Logs
I usually recommend you analyze application logs as the first step when attempting to identify the source of an application error or, in general, to review your app’s health. Let’s explore the logging capabilities of some common applications.
Apache Log
Apache generates two types of logs to help provide valuable insights into the health of the Apache server, its resource utilization patterns, and associated metrics:
- Access logs include the server’s response codes, resource access information, time of access, source IP address, and other details. In Ubuntu, Apache access logs can be found at /var/log/apache2/access.log.
- Error logs log any errors that happen while the Apache server processes requests. These are very helpful to troubleshoot Apache server issues and can contain insights into the root cause. In Ubuntu machines, Apache error logs are available at /var/log/apache2/error.log.
Read the Apache logs guide to learn more.
NGINX Log
NGINX provides multiple log files that the administrator can configure to provide insights into activities on the server:
- Access logs provide information about the resource access pattern on the server, i.e., response code, user agent, source IP address, etc. The default log location is /var/log/nginx/access.log.
- Error logs contain all NGINX errors, related to both configuration or access. You can find them at /var/log/nginx/error.log.
If you’re using NGINX, read NGINX logging guide to learn more about how to work with NGINX logs.
Docker Log
As Docker containers are ephemeral, capturing the logs requires additional configuration.
The logs sent by containers to stdout or stderr should be forwarded by a logging driver to the log destination. The logs are streamed to the /var/lib/docker/containers/ directory of the container host machines. Access them using the following command:
$ docker logs [OPTIONS] <CONTAINER-NAME OR ID>
Read our blog post on Docker logs for a deep dive into Docker logging.
HAProxy Log
HAproxy logs provide useful information to troubleshoot the errors encountered by clients accessing the applications with an HAProxy frontend. In the event of an error, a corresponding log will be written in HAProxy log files. Ubuntu systems, you can locate this log at /var/log/haproxy.log.
Check out the HAProxy logging guide if HAProxy is part of your technology stack.
PostgreSQL Log
By default, PostgreSQL logs are streamed to stderr. The logs will, however, be written to the default OS log directory if the logging_collector parameter of the service is enabled. Log files of the PostgreSQL server in Ubuntu can be found at /var/log/postgresql/postgresql-x.x.main.log. X.x.
If you’re running PostgreSQL on Ubuntu, read our post on PostgreSQL logging to learn how to best handle its logs.
Other Useful Logs
In addition to the abovementioned logs, there are some additional Ubuntu server logs that the system generates but are not human-readable. These logs are also stored in the /var/log folder.
Login Failure Log
These logs contain information about the latest login failures in the system. The logs files are located at /var/log/faillog. The data here can be parsed using the faillog command to view the latest login failures.
Last Logins Log
This log lists the most recent logins to the system. The log file is located at /var/log/lastlogin. To parse the log and view a list of last logins to the system, use the following command:
lastlog | less
Login Records Log
This log stores information about users currently logged into the system. The log file is located at /var/log/wtmp and can be parsed by command line utilities such as the command who.
Logs provide a wealth of information to help troubleshoot issues or errors in the Ubuntu system or applications deployed in it. But to view and analyze the log files, additional tools are required, some of which I’ll cover here.
GNOME Logs App
GNOME is a commonly used desktop GUI interface for Ubuntu. In the latest versions of Ubuntu GNOME, a log viewer utility named “Logs” is available out of the box. It’s a GUI utility that helps you view a number of log files including your hardware, system, application, security, etc.
In the Ubuntu Dash, search for “Logs” to open the utility. The utility contains different tabs to view the logs. For example, you can click on the “System” tab to view the system logs. You can also view additional details about specific logs by clicking on them or search for logs using keywords.
Log File Viewer
The log file viewer is another GUI-based tool that lets you view and analyze logs and is available in older versions of Ubuntu. To access the utility, search for “Log Viewer” in the Ubuntu Dash. It has several categories like syslog, auth.log, kern.log, etc. listed on the left panel. You can use these to explore respective log types. You can also search for specific logs using keywords.
Terminal
Administrators comfortable with the command-line mode of analyzing logs can use the Ubuntu terminal. There are several commands available to view the log files in Ubuntu:
tailto view the last few lines of the log filedmesgto view log messages from Kernel’s buffercatto open and view log filesmorefor when you want to browse through the log file one screen at a time; use space bar to go to the next pagelessalso displays content of log files one screen at a time but has additional options to scroll forward, backward, and searchgrepto search for specific keywords within a log; helpful if you are looking for information on specific incidents/errors in the log file, for example,dmesg |grep [keyword]
Journalctl Command
In earlier sections, I talked about journald, which is the systemd’s logging service or, in other words, the log management daemon in Ubuntu. Journalctl is the utility available for viewing and querying these logs since they’re stored in binary format by journald. You can use it without any parameters to view all the content of the systemd journal:
journalctl
As all the logs in the journal will be overwhelming to comprehend, use appropriate filters for the output. For instance, to view only messages within a specified timeframe, input the following command:
journalctl --since “2 hours ago”
To view logs associated with a specific systemd unit, use the -u switch. For example, to view logs from the MySQL service:
journalctl -u mysql.service
You can also view log messages related to activities of a specific user with the UID of the user as a switch, as shown below:
journalctl _UID=209
You cam use the –since and –until switches to view logs within a time period:
journalctl --since "2022-07-21 23:15:00" --until "2022-07-21 23:20:00"
Ubuntu System Logging Daemon Configuration
Syslogd, also known as sysklogd, is the default system logging daemon in Ubuntu. It performs the task of receiving messages from different system sources and sends them to the defined log file destination. Besides log messages, additional useful metadata like timestamps for when the logs are generated, source system hostnames, etc. are also captured in these log files.
You can configure the log files destination and the priority level of logs by editing the /etc/syslog.conf file. The selector field in the configuration file specifies the logging facility and the required log priority level. For example, you can choose the auth logging facility and the priority as “info” or “warning”.
The log destination file is specified by the action field. This could be the default Ubuntu server log files location, i.e., /var/log/syslog, or the name of a centralized logging server.
Ubuntu Log Rotation
With multiple logs generated every minute by different system and application components, the log file data can easily consume the entire disk space in your machine. So it’s important to compress and archive log files periodically. This process is called log rotation. Initially, logs are renamed after a specified timeframe and a new log file gets created for the latest logs. The logs are then compressed to save disk space. The utility used to manage this log rotation process is called “logrotate”.
Using Logrotate
Configure the logrotate utility via the file /etc/logrotate.conf. With the default settings in logrotate.conf, Ubuntu rotates log files weekly for files owned by the Ubuntu syslog server group and root user, with a default retention of four logs at a time.
When current logs are rotated, new empty log files are created to which the logs get streamed. The logrotate utility is invoked from the cron script /etc/cron.daily/logrotate.
You can add a log rotation configuration specific to applications to /etc/logrotate.d/. This is also where you can define the log rotation settings of system tools like APT, syslog, and dpkg or for specific applications like MySQL and Apache2.
Useful Commands for Working with Ubuntu Logs
Let’s look at some of the basic commands you can use in an Ubuntu terminal to explore log files.
Change Log Directory
The first step for accessing logs would be to switch to the log file directly using the following command:
cd /var/log
Search Log Files
Log files can contain a lot of information, so you might sometimes have to use the search option to drill down to the relevant log content, or you can use the grep command. For example, to search for all lines with the word “error” in a log file:
grep “error' kern.log
Edit Log Files
Simple text editors like nano let you edit and make changes in the log files. Note that to save changes, you will have to use the sudo command, which is not a recommended practice. A sample command for editing the log file is:
nano test.log
Monitor Log Files
As log files are continuously getting updated, use the following command to monitor those changes in real time:
tail -f error.log
While the utilities and tools discussed above can be helpful in analyzing logs in individual servers, when it comes to large-scale infrastructure deployments you need to consider custom-built solutions for Ubuntu log management and analysis like Sematext Logs. You may have to correlate events and logs across multiple systems, and the manual analysis of logs could become cumbersome.
Ubuntu Log Analysis and Monitoring with Sematext
Sematext Logs is a log management tool that can provide out-of-the-box integration for monitoring Ubuntu logs. It’s a full-spectrum solution, capable of collecting logs and events in real time from your Ubuntu systems, then parsing and analyzing them to give deeper visibility into your Ubuntu hosts. It allows you to set up threat or anomaly detection alerts to be warned about any potential issues upfront, which helps bring down troubleshooting time.
Simply install the Sematext agent for an intuitive UI that lets you select the type of logs you want to monitor to cut out the noise and focus on relevant information. For example, the agent is capable of collecting logs from important system components like systemd-journal as well as specific applications like NGINX.
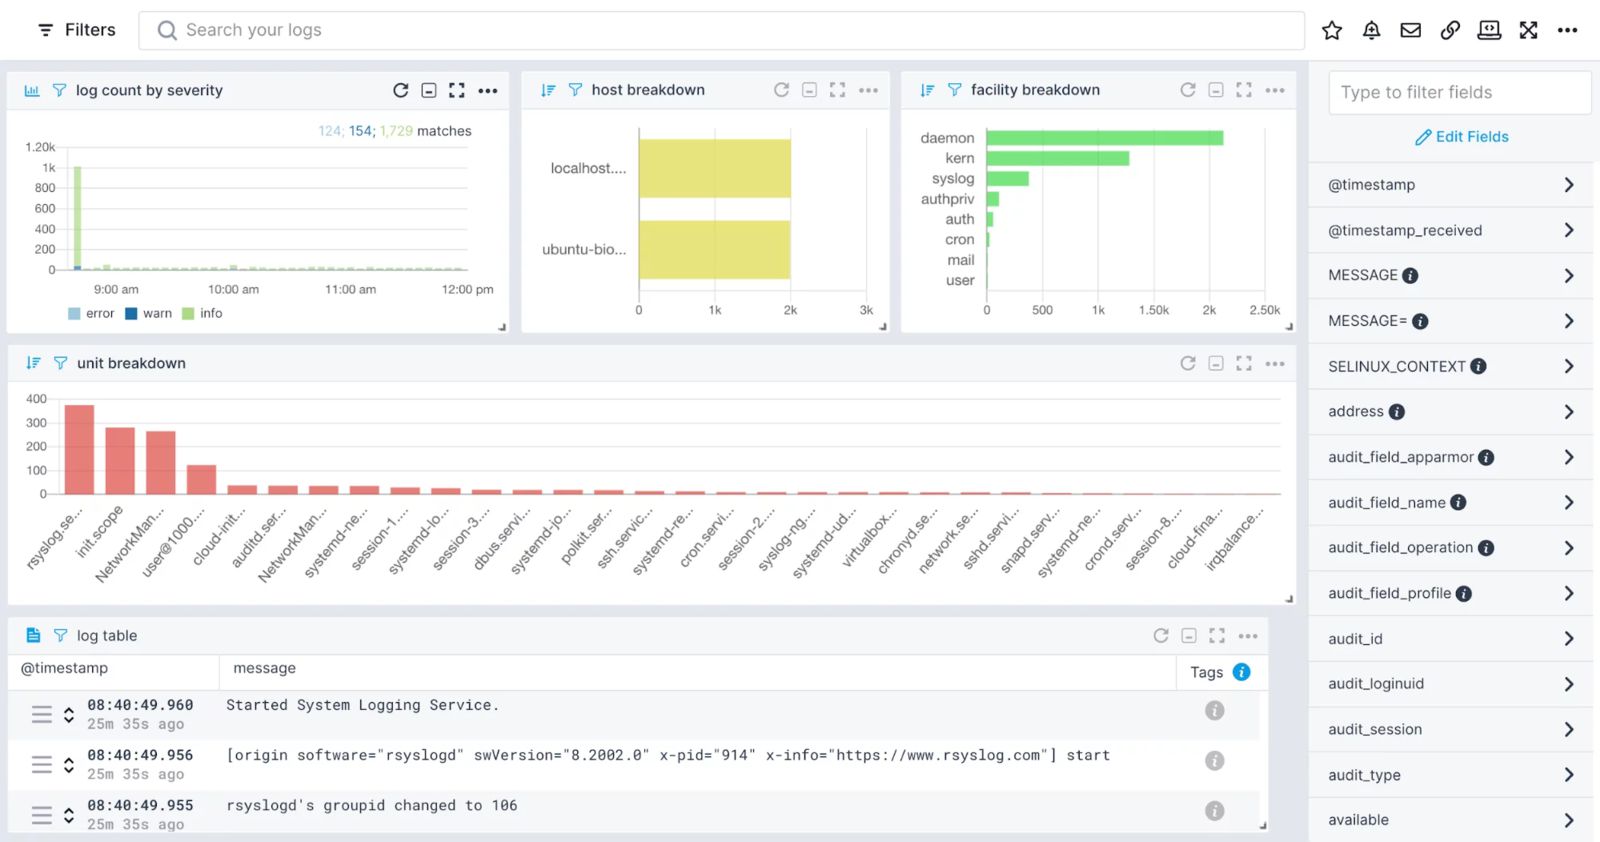
Sematext – Ubuntu logs overview
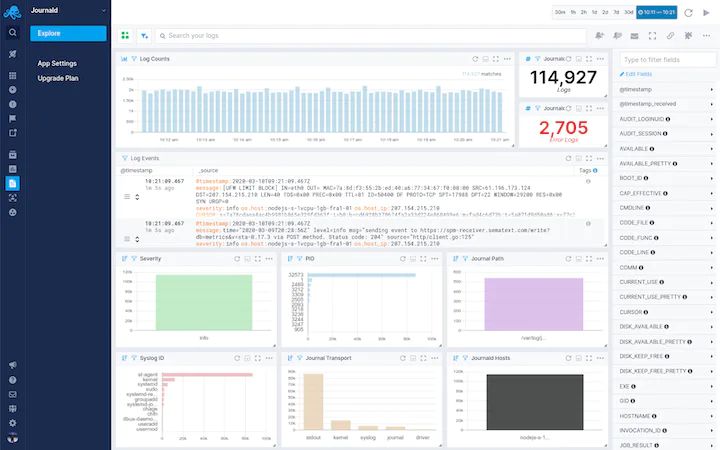
Sematext – Ubuntu journald log view
You can configure the Ubuntu logging options, input, output, and parser in the agent configuration file as per your log monitoring requirements. Moreover, being part of the Sematext Cloud monitoring suite, it allows you to also correlate the data from your logs with additional context from performance metrics for faster troubleshooting and debugging. Sematext Cloud even helps you build an actionable dashboard for a bird’s-eye view of the state of your Ubuntu system.
Watch the video below to learn more about what Sematext Logs can do for you or jumpstart your logging journey by trying out the 14-day free trial!
Conclusion
Ubuntu logs provide a wealth of information that can help you troubleshoot your operating system as well as application errors. You need to select the right log files for review to reduce the turnaround time. Ensure that the log files are configured to capture the level of detail your organization requires. Ubuntu’s built-in tools for viewing logs can help with the first level of analysis. This approach works well if you have only a few systems to monitor.
However, large-scale log ingestion and management needs enterprise-scale specialized tools like Sematext Logs. When your Ubuntu landscape is expansive, this requirement becomes even more prevalent, especially due to the sheer volume of logs generated. Without the right tools at your disposal, finding the source of outages and correcting them could prove to be a difficult undertaking.
Author Bio
Jean-Christophe Dansereau
Jean-Christophe Dansereau is a Canadian software engineer and tech writer, specializing in backend and cloud engineering. He helps tech companies develop and scale applications and write technical blogs to allow organizations to communicate their message.
Start Free Trial